

- 2.67 MB
- 2022-04-29 13:55:00 发布
- 1、本文档共5页,可阅读全部内容。
- 2、本文档内容版权归属内容提供方,所产生的收益全部归内容提供方所有。如果您对本文有版权争议,可选择认领,认领后既往收益都归您。
- 3、本文档由用户上传,本站不保证质量和数量令人满意,可能有诸多瑕疵,付费之前,请仔细先通过免费阅读内容等途径辨别内容交易风险。如存在严重挂羊头卖狗肉之情形,可联系本站下载客服投诉处理。
- 文档侵权举报电话:19940600175。
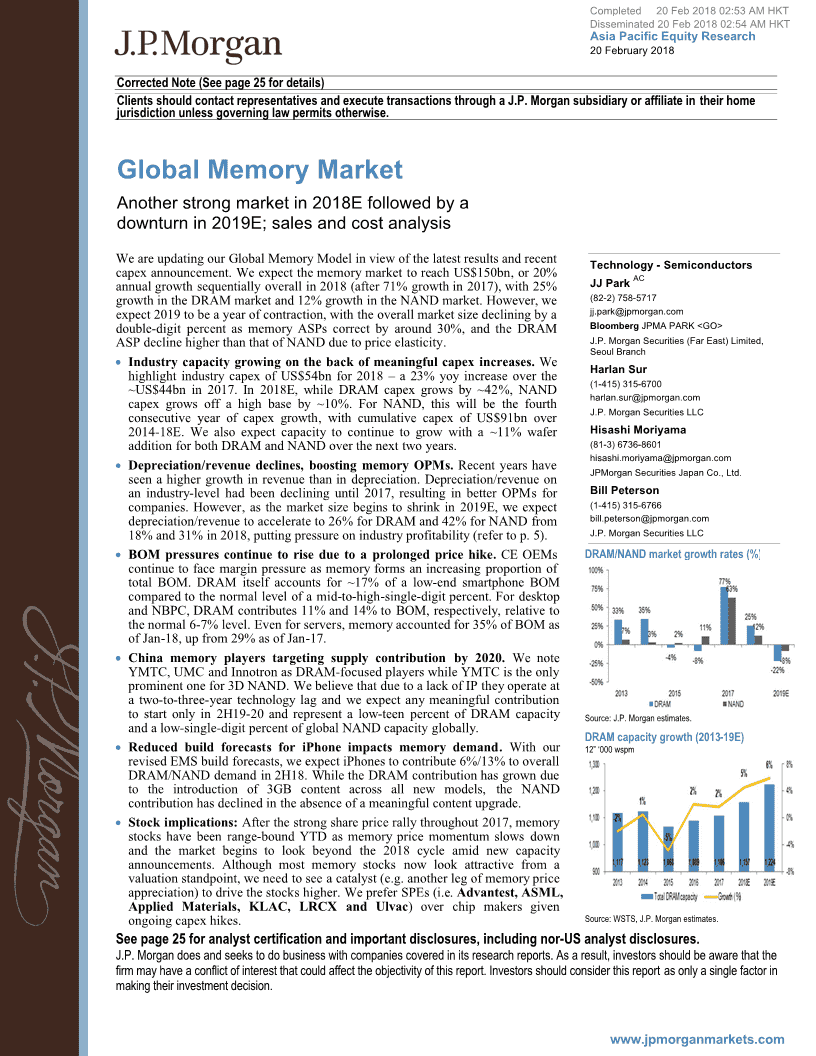
'Completed20Feb201802:53AMHKTDisseminated20Feb201802:54AMHKTAsiaPacificEquityResearch20February2018CorrectedNote(Seepage25fordetails)ClientsshouldcontactrepresentativesandexecutetransactionsthroughaJ.P.Morgansubsidiaryoraffiliateintheirhomejurisdictionunlessgoverninglawpermitsotherwise.GlobalMemoryMarketAnotherstrongmarketin2018Efollowedbyadownturnin2019E;salesandcostanalysisWeareupdatingourGlobalMemoryModelinviewofthelatestresultsandrecentTechnology-Semiconductorscapexannouncement.WeexpectthememorymarkettoreachUS$150bn,or20%ACannualgrowthsequentiallyoverallin2018(after71%growthin2017),with25%JJParkgrowthintheDRAMmarketand12%growthintheNANDmarket.However,we(82-2)758-5717expect2019tobeayearofcontraction,withtheoverallmarketsizedecliningbyajj.park@jpmorgan.comdouble-digitpercentasmemoryASPscorrectbyaround30%,andtheDRAMBloombergJPMAPARKASPdeclinehigherthanthatofNANDduetopriceelasticity.J.P.MorganSecurities(FarEast)Limited,SeoulBranchIndustrycapacitygrowingonthebackofmeaningfulcapexincreases.WeHarlanSurhighlightindustrycapexofUS$54bnfor2018–a23%yoyincreaseoverthe(1-415)315-6700~US$44bnin2017.In2018E,whileDRAMcapexgrowsby~42%,NANDharlan.sur@jpmorgan.comcapexgrowsoffahighbaseby~10%.ForNAND,thiswillbethefourthJ.P.MorganSecuritiesLLCconsecutiveyearofcapexgrowth,withcumulativecapexofUS$91bnover2014-18E.Wealsoexpectcapacitytocontinuetogrowwitha~11%waferHisashiMoriyamaadditionforbothDRAMandNANDoverthenexttwoyears.(81-3)6736-8601hisashi.moriyama@jpmorgan.comDepreciation/revenuedeclines,boostingmemoryOPMs.RecentyearshaveJPMorganSecuritiesJapanCo.,Ltd.seenahighergrowthinrevenuethanindepreciation.Depreciation/revenueonanindustry-levelhadbeendeclininguntil2017,resultinginbetterOPMsforBillPetersoncompanies.However,asthemarketsizebeginstoshrinkin2019E,weexpect(1-415)315-6766depreciation/revenuetoaccelerateto26%forDRAMand42%forNANDfrombill.peterson@jpmorgan.com18%and31%in2018,puttingpressureonindustryprofitability(refertop.5).J.P.MorganSecuritiesLLCBOMpressurescontinuetoriseduetoaprolongedpricehike.CEOEMsDRAM/NANDmarketgrowthrates(%)continuetofacemarginpressureasmemoryformsanincreasingproportionoftotalBOM.DRAMitselfaccountsfor~17%ofalow-endsmartphoneBOMcomparedtothenormallevelofamid-to-high-single-digitpercent.FordesktopandNBPC,DRAMcontributes11%and14%toBOM,respectively,relativetothenormal6-7%level.Evenforservers,memoryaccountedfor35%ofBOMasofJan-18,upfrom29%asofJan-17.Chinamemoryplayerstargetingsupplycontributionby2020.WenoteYMTC,UMCandInnotronasDRAM-focusedplayerswhileYMTCistheonlyprominentonefor3DNAND.WebelievethatduetoalackofIPtheyoperateatatwo-to-three-yeartechnologylagandweexpectanymeaningfulcontributiontostartonlyin2H19-20andrepresentalow-teenpercentofDRAMcapacitySource:J.P.Morganestimates.andalow-single-digitpercentofglobalNANDcapacityglobally.DRAMcapacitygrowth(2013-19E)ReducedbuildforecastsforiPhoneimpactsmemorydemand.Withour12”‘000wspmrevisedEMSbuildforecasts,weexpectiPhonestocontribute6%/13%tooverallDRAM/NANDdemandin2H18.WhiletheDRAMcontributionhasgrownduetotheintroductionof3GBcontentacrossallnewmodels,theNANDcontributionhasdeclinedintheabsenceofameaningfulcontentupgrade.Stockimplications:Afterthestrongsharepricerallythroughout2017,memorystockshavebeenrange-boundYTDasmemorypricemomentumslowsdownandthemarketbeginstolookbeyondthe2018cycleamidnewcapacityannouncements.Althoughmostmemorystocksnowlookattractivefromavaluationstandpoint,weneedtoseeacatalyst(e.g.anotherlegofmemorypriceappreciation)todrivethestockshigher.WepreferSPEs(i.e.Advantest,ASML,AppliedMaterials,KLAC,LRCXandUlvac)overchipmakersgivenongoingcapexhikes.Source:WSTS,J.P.Morganestimates.Seepage25foranalystcertificationandimportantdisclosures,includingnon-USanalystdisclosures.J.P.Morgandoesandseekstodobusinesswithcompaniescoveredinitsresearchreports.Asaresult,investorsshouldbeawarethatthefirmmayhaveaconflictofinterestthatcouldaffecttheobjectivityofthisreport.Investorsshouldconsiderthisreportasonlyasinglefactorinmakingtheirinvestmentdecision.www.jpmorganmarkets.com
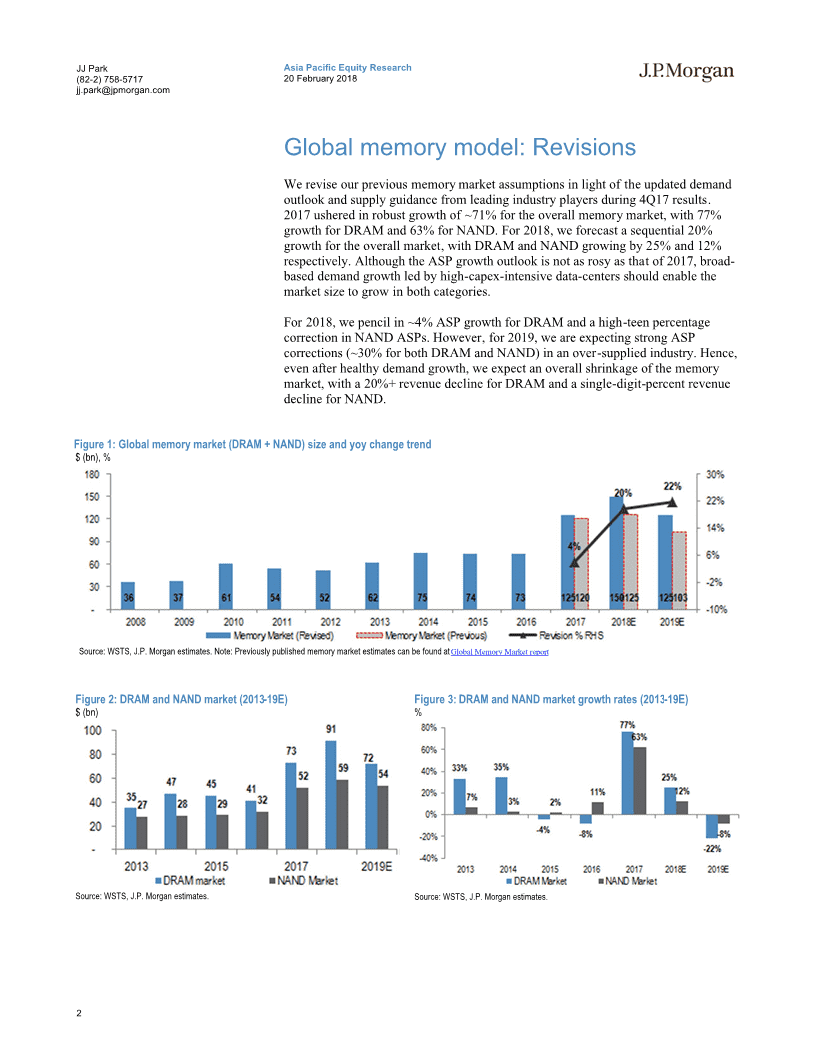
JJParkAsiaPacificEquityResearch(82-2)758-571720February2018jj.park@jpmorgan.comGlobalmemorymodel:RevisionsWereviseourpreviousmemorymarketassumptionsinlightoftheupdateddemandoutlookandsupplyguidancefromleadingindustryplayersduring4Q17results.2017usheredinrobustgrowthof~71%fortheoverallmemorymarket,with77%growthforDRAMand63%forNAND.For2018,weforecastasequential20%growthfortheoverallmarket,withDRAMandNANDgrowingby25%and12%respectively.AlthoughtheASPgrowthoutlookisnotasrosyasthatof2017,broad-baseddemandgrowthledbyhigh-capex-intensivedata-centersshouldenablethemarketsizetogrowinbothcategories.For2018,wepencilin~4%ASPgrowthforDRAMandahigh-teenpercentagecorrectioninNANDASPs.However,for2019,weareexpectingstrongASPcorrections(~30%forbothDRAMandNAND)inanover-suppliedindustry.Hence,evenafterhealthydemandgrowth,weexpectanoverallshrinkageofthememorymarket,witha20%+revenuedeclineforDRAMandasingle-digit-percentrevenuedeclineforNAND.Figure1:Globalmemorymarket(DRAM+NAND)sizeandyoychangetrend$(bn),%Source:WSTS,J.P.Morganestimates.Note:PreviouslypublishedmemorymarketestimatescanbefoundatGlobalMemoryMarketreportFigure2:DRAMandNANDmarket(2013-19E)Figure3:DRAMandNANDmarketgrowthrates(2013-19E)$(bn)%Source:WSTS,J.P.Morganestimates.Source:WSTS,J.P.Morganestimates.2
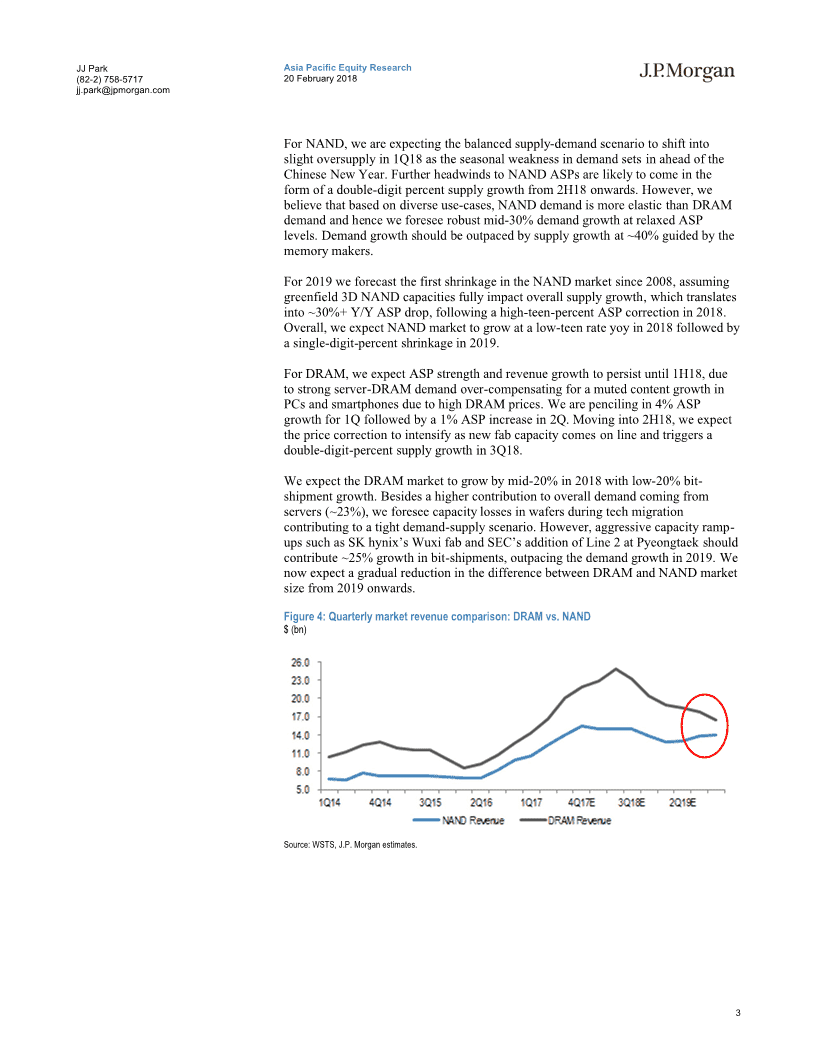
JJParkAsiaPacificEquityResearch(82-2)758-571720February2018jj.park@jpmorgan.comForNAND,weareexpectingthebalancedsupply-demandscenariotoshiftintoslightoversupplyin1Q18astheseasonalweaknessindemandsetsinaheadoftheChineseNewYear.FurtherheadwindstoNANDASPsarelikelytocomeintheformofadouble-digitpercentsupplygrowthfrom2H18onwards.However,webelievethatbasedondiverseuse-cases,NANDdemandismoreelasticthanDRAMdemandandhenceweforeseerobustmid-30%demandgrowthatrelaxedASPlevels.Demandgrowthshouldbeoutpacedbysupplygrowthat~40%guidedbythememorymakers.For2019weforecastthefirstshrinkageintheNANDmarketsince2008,assuminggreenfield3DNANDcapacitiesfullyimpactoverallsupplygrowth,whichtranslatesinto~30%+Y/YASPdrop,followingahigh-teen-percentASPcorrectionin2018.Overall,weexpectNANDmarkettogrowatalow-teenrateyoyin2018followedbyasingle-digit-percentshrinkagein2019.ForDRAM,weexpectASPstrengthandrevenuegrowthtopersistuntil1H18,duetostrongserver-DRAMdemandover-compensatingforamutedcontentgrowthinPCsandsmartphonesduetohighDRAMprices.Wearepencilingin4%ASPgrowthfor1Qfollowedbya1%ASPincreasein2Q.Movinginto2H18,weexpectthepricecorrectiontointensifyasnewfabcapacitycomesonlineandtriggersadouble-digit-percentsupplygrowthin3Q18.WeexpecttheDRAMmarkettogrowbymid-20%in2018withlow-20%bit-shipmentgrowth.Besidesahighercontributiontooveralldemandcomingfromservers(~23%),weforeseecapacitylossesinwafersduringtechmigrationcontributingtoatightdemand-supplyscenario.However,aggressivecapacityramp-upssuchasSKhynix’sWuxifabandSEC’sadditionofLine2atPyeongtaekshouldcontribute~25%growthinbit-shipments,outpacingthedemandgrowthin2019.WenowexpectagradualreductioninthedifferencebetweenDRAMandNANDmarketsizefrom2019onwards.Figure4:Quarterlymarketrevenuecomparison:DRAMvs.NAND$(bn)Source:WSTS,J.P.Morganestimates.3
JJParkAsiaPacificEquityResearch(82-2)758-571720February2018jj.park@jpmorgan.comMemorycapexchanges(2018)Basedonnewcompanyguidance,therewillbeameaningfulupwardrevisionof29%foroverallmemoryindustrycapexin2018,amountingtoUS$54bn(vsthepreviousUS$44bn),whichrepresents19%YoYgrowth.Breakingthisdown,themajorityofthecapexgrowthcomesfromDRAM(US$24.5bn),at42%,with10%(US$30bn)fromNANDoveranalreadyhighbasein2017.Atthecompanylevel,SECwillgrowitsDRAMcapexto~W12.2trngrowingconsecutivelyat40%in2018aftera~140%growthin2017.HowevertheNANDcapexisexpectedtocomedown23%to~W8trnfromahigh-levelofW11trnin2017.SKhynixisexpectedtoramp-uptheoverallcapexby50%toW14.5trnwitha55%-45%breakdownforDRAM-NAND.In2018,Micronisalsoexpectedtojointheindustrybandwagonwitha~38%capexgrowthYoYamountingto~US$7.5bnwitha50%-50%splitforDRAMandNAND.Webelievethatthemajorplayersareplanningaggressivecapexgrowthtoretain/regainmarketsharewhileridingtheprotractedboominmemoryASP’s.Whileasignificantportionwouldbeattributedtogreen-fieldfabdevelopmentandequipmentprocurement,asizableportionwouldalsobedirectedforcoping-upwiththebit-growthlossesthatgetimpactedbytechmigrationtosmallernodes.Figure5:DRAMcapextrendFigure6:NANDcapextrend$(bn),%$(bn),%Source:J.P.Morganestimates.Source:J.P.Morganestimates.IncreasingdepreciationexpenseAnanalysisofdepreciationtrendspointstoincreasingdepreciation,withaggressivecapex.Basedonfive-yearcapexallocation,weforecastanoverall30%growthinmemoryindustrydepreciationinboth2017and2018onasequentialbasis,withabreakdownof$16bn/$18bnindepreciationforDRAM/NANDrespectivelyin2018.However,wewouldalsoliketohighlightthatthedeclineindepreciation/revenuein2017willpickupto30%+in2019.Thisillustratesthat,recently,duetoastrongpriceenvironment,revenuegrowthwasmuchstrongerthanindustrydepreciationgrowth.Adecliningdepreciationexpenserelativetorevenuealsoindicatesagrowingoperatingmarginformemorymakers.Lookinginto2019,duetoourforecastofadouble-digit-percentshrinkageintheoverallmemorymarketsizeandhighcumulativecapexinpreviousyears,weexpectthedepreciation/revenueratiotopickupandhenceputpressureonprofits.4
JJParkAsiaPacificEquityResearch(82-2)758-571720February2018jj.park@jpmorgan.comFigure7:Industrydepreciationtrend(2008-19E)Figure8:Industrydepreciation/revenuetrend(2008-19E)$(mn),%$(mn),%Source:Companydata,J.P.Morganestimates.Source:Companydata,J.P.Morganestimates.Figure9:DRAMdepreciation/revenuetrend(2008-19E)Figure10:NANDdepreciation/revenuetrend(2008-19E)$(mn),%$(mn),%Source:Companydata,J.P.Morganestimates.Source:Companydata,J.P.Morganestimates.Figure11:AnnualOPMtrendforDRAM(2010-19E)Figure12:AnnualOPMtrendforNAND(2010-19E)$(mn),%$(mn),%Source:Companydata,J.P.Morganestimates.Source:Companydata,J.P.Morganestimates.5
JJParkAsiaPacificEquityResearch(82-2)758-571720February2018jj.park@jpmorgan.comDRAMSupply:Wehavemadeslightdownwardrevisionstooursupplyestimatesaswefactor-inthewafer-capacitylossesduringtechmigration.As2018capexforDRAMfurthergrowsby17%yoyandhenceweareexpectingawafergrowthof~5%in2018.Movinginto2019,weexpectthesupplygrowthwouldaccelerateto25%asyieldsimproveandwouldprovideheadwindstoASP’sbyover-compensatingfordemandgrowth.Demand:Amongstamutedvolumegrowthfordesktops/notebooksandamaturingChinesesmartphonemarketwithjustamid-single%annualincreaseinsmartphoneshipments,mostoftheDRAMdemandgrowthiscontent-drivengrowth.Growingdual-camadoption,higherresolutionscreens,on-deviceAI/ARandheavierapplicationsdemandagreaterprocessingpower.However,withnorelieftohigh-ASPlevelsuntil2H18,webelievecontent-growthisunsustainableandhencewemadedownwardrevisionstoourcontentassumptionsacrossallCEcategoriesexceptserver.Insuchascenario,demandgrowthfromprice-inelasticcategorieslikeserversthataresolelydrivenbyperformanceupgrades,wouldbehigherascomparedtotheothersASP:Givenlimitedcleanroomavailabilityandwafer-lossduringtechmigration,wereviseourASPassumptionstoreflectasingle-digit%growthuntil1H18.Whilefactoringinadouble-digit%correctionfrom2H18onwards,wepencil-inamid-singledigit%growthfor2018overall.NANDSupply:Despitemeaningfulcapexincrease,wehavemadeaslightdownwardrevisiontoNANDsupplyestimatesgivenongoingyieldissuesat64L3DNAND.For2018,weexpectNANDbitshipmentgrowthtobeat~40%whichisin-linewiththecompanyguidanceasSEC’sramps-upPyeongtaeklineandSKhynix’sgrowsndproductionat2flooratM14fab.Demand:Wepenciled-inamid-30%demandgrowthfor2018.Givenabroad-basedapplicationdemandforNANDandongoingprice-correctionfor64Gb/128GbTLCcategory,weforeseeahealthygrowthatrelaxedASP’s.HoweverassmartphoneBOMpressuresremainhigh,weforecastahigheradoptionofNANDinboththeenterpriseandclientSSDsegment.WewouldliketohighlightthatSSDcontributiontooverallNANDdemand,growsfrom36%in2017to~40%in2018drivenbyameaningfuldensitygrowth.ASP:Althoughthespotpricescontinuetocorrectsincethe4Q17,bothSECandSKhynixreportedblendedASPgrowthforthesameperiodduetoimprovingproduct-mix,as3Dyieldsimproved.Hencetofactor-intherevisedguidance,wehavealsomadea7%and13%upwardrevisioninNANDASP"sfor2017/18respectively.Howevergivensuccessful3DNANDramp-upsbynonSECcamps,westillprojectahigh-teen%correctioninNANDASP’sfor2018overall.6
JJParkAsiaPacificEquityResearch(82-2)758-571720February2018jj.park@jpmorgan.comTable1:J.P.MorganGlobalMemoryModel:SummaryofchangesRevisedPriorChange(%)201720182019201720182019201720182019Memoryrevenue(US$,bn)125.0149.9125.3120.2125.3103.04%20%22%DRAMrevenue72.891.271.672.672.952.80%25%36%NANDrevenue52.258.753.847.652.350.210%12%7%Memoryprice(US$)DRAMASP(2Gb.)1.601.671.061.591.300.781%28%36%NANDASP(64Gb.)2.31.91.32.201.691.177%13%9%Memoryshipments(mn)DRAMshipments(2Gb.)45,50854,70167,60545,72856,22267,6080%-3%0%NANDshipments(64Gb.)22,26430,65142,12821,97030,93942,8051%-1%-2%Shipments(mn)Desktops10396931031011000%-5%-7%Notebooks1731701691731701710%0%-1%Servers1212121212130%-2%-3%Smartphones1,5761,6561,6871,5281,5841,6373%5%3%Tablets1621541541571501483%3%4%SSDs180216110190228110-5%-5%0%AverageDRAMmemory(MB)Desktops5,0265,3325,8284,9405,4386,0442%-2%-4%Notebooks5,8486,2656,8575,7406,3067,0162%-1%-2%Servers199,339261,100338,628191,877244,511306,6084%7%10%Smartphones2,3762,7173,3832,3482,9413,4381%-8%-2%Tablets2,5822,9933,5493,0643,5214,052-16%-15%-12%AverageNANDmemory(MB)SSDs368,503449,688581,247392,964452,537544,439-6%-1%7%Smartphones37,45545,80859,47337,61748,13669,8830%-5%-15%Tablets51,50466,22091,63553,19667,80183,635-3%-2%10%SupplyassumptionsDRAM(2Gbe.,M)45,19854,74168,20645,45156,50768,900-1%-3%-1%NAND(64Gbe.,M)22,13731,00842,99921,75431,44443,3672%-1%0%Memorycapex(US$,mn)44,35054,449-45,00842,372--1%29%naDRAM17,24224,502-19,15120,963--10%17%naNAND27,10829,947-25,85721,409-5%40%naSource:J.P.Morgan.DRAMmarketServers:TheleadinggrowthdriverforDRAMdemandWehaveusedatop-downapproachtoestimatetheDRAMdemandcontributionfromserverDRAM,usingtheshipmentsandrespectivedensitylevelsfor1-socket,2-socketsand4+sockets.Wehavealsotakenintoaccountbottom-upcompanyrevenuesandcomplementedthiswithatop-downrevenuecalculationusingthetotaldemand(2Gbequivalent)andourrespectiveASPassumptions(Price/2Gbequivalent)fromtheoverallDRAMmodel.Afteraccountingfora40%+blendedDRAMdensitygrowthinservers,weforecastanother30%+hikeforboth2018and2019.Whileoverallservershipmentsshouldgrowatalow-single-digitrate,thepercentageofhigh-endservers(4+sockets/CPU)shouldgrowfastestrelativetoothercategoriesonthebackofthesizableinvestmentbyISP(InternetServiceProviders).OnanaggregatebasisweforeseetheserverDRAMcapturinganincreasingshareoftheoverallpie,accountingfor23%/25%oftotalDRAMdemandin2018/19respectively.7
JJParkAsiaPacificEquityResearch(82-2)758-571720February2018jj.park@jpmorgan.comFigure13:ServerDRAMdemandasa%oftotalDRAMdemandFigure14:ServerDRAMrevenueasa%oftotalDRAMrevenue2GbEQinmillions,%USDinmillions,%Source:J.P.Morganestimates,GartnerSource:J.P.Morganestimates,GartnerRobustserverpricetrendOptimizationofdata-centereconomicsintermsofspaceandpowerandshifttoaTCO(TotalCostofownershipmodel)wouldalsoneedtheadoptionofahigherdensityofDRAMperboxthanthetraditionaldemandforlower-densitymodules.Furthermore,withanongoingshifttodata-centervirtualization,theintegrationofAI-drivenapplicationsisatanall-timehigh.Applicationsthatworkoncomplexcalculationwillcarryahugeprocessingworkloadandhencerequiremoreprocessingmemory.Wearefactoringinahigh-single-digitpercentqoqgrowthin1Q/2QserverASPstranslatingintoahigh-single-digitpercentASPgrowthforthefull-yearbasis.Figure15:DRAMmarketrevenueandASPyoychange(Annual)Figure16:DRAMmarketrevenueandyoychange(Quarterly)$(bn),%$(bn),%Source:WSTS,J.P.Morganestimates.Source:WSTS,J.P.Morganestimates.Figure17:DRAMdemandbyapplications(2015-19E)Figure18:DRAMdemandgrowthbykeyapplications(2015-19E)%%Source:Gartner,J.P.Morganestimates.Note:Otherscategoryincludestablets,upgradesandSource:Gartner,J.P.Morganestimates.otherapplicationssuchasautomotive,industrial,consumerelectronics,etc.8
JJParkAsiaPacificEquityResearch(82-2)758-571720February2018jj.park@jpmorgan.comFigure19:DRAMrevenuebyapplications(2015-19E)Figure20:DRAMrevenuegrowthbykeyapplications(2016-19E)%%Source:Gartner,J.P.Morganestimates.Note:Otherscategoryincludestablets,upgradesandSource:Gartner,J.P.Morganestimates.otherapplicationssuchasautomotive,industrial,consumerelectronics,etc.Figure21:DRAMASPchangebykeysegmentsFigure22:BlendedDRAMASPandyoychange%ASPstatedin2Gbe.($),%2.70120%2.4075%2.1051%80%46%1.8029%29%29%40%1.50-3%1%1.20-18%0%0.90-37%-31%-41%-40%-39%-43%-44%0.60-40%0.30--80%1Q163Q161Q17E3Q17E1Q18E3Q18E1Q19E3Q19EBlendedDRAMASP(2Gbeq)yoychange(%)RHSSource:IHS,DRAMeXchange,WSTS,J.P.Morganestimates.Source:WSTS,J.P.Morganestimates.Figure23:16GBServervsPCDRAMASPtrend(monthly)Figure24:4GBContractPCvsMobileDRAMASPtrend(monthly)$,%$,%Source:Trendforce,J.P.Morganestimates.Source:Trendforce,J.P.Morganestimates.9
JJParkAsiaPacificEquityResearch(82-2)758-571720February2018jj.park@jpmorgan.comDRAMcapacitygrowthtrendBasedonrecenthikesincapex,weexpectaverageglobalDRAMcapacityfor2019togrowby11%fromthe2017averagelevel.Whiletherewouldbeasignificantcapexdirectedfornewcapacityadditionsin2018-19,wefactorina5%/6%sequentialYoYgrowthinwafers,accountingforthecapacitylossfromtech-migration.Withpre-emptivegreen-fieldmeasuressuchasSEC’sPyungtaekline2,weexpectcapacitygrowthtocontinuefurtherinto2020.Figure25:DRAMcapacitytrendforindustryleaders(13-19E)Figure26:DRAMindustrycapacitygrowthoverall(13-19E)12”eq.000’wspm12”eq.000’wspmSource:Companydata,J.P.Morganestimates.Source:Companydata,J.P.Morganestimates.SECfurtherstrengthensDRAMcapacitywithLine2additionatPyeongtaekAsperourlatestwebalertonSEC,wehavepointedouttheconstructionofanotherLineatthePyeongtaekfabwithacapacityof200K/monthvis-à-visa300K/monthcapacityatNo.1fab.BasedonDRAMunitshare,wecurrentlyfactorinamarketsharelossforSEC,whichaccountedforamid-40%marketshare,reducedfromhigh-40%in2016.Theadditionalfabwouldmeaningfullyincreaseitsmarketsharefrom2020onwards(~50%)unlessotherpeersannouncefurthermajorcapacityexpansionplans.Weseeupsidetototalindustrycapacitygrowthfrom2020whiletheincrementalexpansionismainlycomingfromSECtofurtherenhanceitsmarketshare,followingadditionalDRAMcapacity(Wuxiline)fromSKhynixandsecondflooratPyeongtaekfromSECin2019.WecautiouslyexpectMUtoaddnewcapacitygivencapacityreductionupontechmigrationinforeseeablefuture.Hence,DRAMindustrysupplygrowthcouldfurtheracceleratein2020onwards.ChineseplayersintheDRAMsegmentJHICC(UMC)andInnotron(GigaDevice)arecurrentlythetwoleadingDRAMmanufacturersinChina.UMChastargeteda~60kwspmDRAMcapacitymainlyfocusingonthespecialtyDRAMtargetingconsumerelectronicswhileInnotronhasalsobeentargetinga~60kwspmDRAMcapacityfocusingonmobileDRAMsolutions.WewouldliketopointoutthatanyoperationalmeaningfulcontributiontoDRAMsupplywouldstartonlyin2H19.10
JJParkAsiaPacificEquityResearch(82-2)758-571720February2018jj.park@jpmorgan.comLongestDRAMASPgrowthtrendhistoricallyAsobservedfromthefollowingtrends,thecurrentup-cycleforDRAMASPshasbeenthemostprotracted,lastingforsevenconsecutivequartersofASPgrowthstartingin4Q16andexpectedtolastuntil2Q18.SuchunprecedentedASPhikesareunsustainable,inourview,andhencewepredictadouble-digit-percentASPcorrectionfrom3Q18onwards,aidedbyahigh-capex-ledsupplygrowthinaweakeningend-demandenvironmentfromConsumerelectronicsapplications.Figure27:BlendedDRAMASPmonthlytrend(Jan12-Dec-17)Figure28:BlendedDRAMASPquarterlytrend(2004-17)$,%%Source:WSTS,J.P.Morganestimates.Source:WSTS,J.P.Morganestimates.iPhoneimpactonMobileDRAMdemandandoverallDRAMdemandPointingtoanotherwiseconstantcontributiontooverallDRAMandMobileDRAMdemandfromiPhones,we’dliketohighlightagrowingcontributionin2H18Ethanin2H17.Comparedtothe5%/13%contributiontooverallDRAM/mDRAMdemandin2H17,weforecasta6%/15%contributiontooverallDRAM/mDRAMdemandin2H18.ThisshowsagrowingcontributionfromAppleasallnewmodelssporta3GBRAMcontentbutaweakeningcontributionfromthemid-to-low-endsegment,asthesesegmentsdeceleratecontentgrowthathighermemoryASPlevels.Figure29:iPhoneimpactonoverallDRAMdemandFigure30:iPhoneimpactontotalmDRAMdemandmn2Gbeq.%mn2Gbeq.%Source:J.P.Morganestimates.Source:J.P.Morganestimates.11
JJParkAsiaPacificEquityResearch(82-2)758-571720February2018jj.park@jpmorgan.comBOMcost-burdenforServersandmid-to-low-endsmartphonesAsmDRAMcostformsanincreasingpercentageofBOMforlow-end(16%)andmid-range(9%)smartphonesin2017,strongcontentgrowthandhealthymDRAMASPswouldlikelyhavethebiggestimpactonmid-to-low-endsmartphonecosts.WithanincreasingBOMburdenacrossEMsmartphones,theongoinginterventionbyNDRConthebehalfofChinasmartphoneOEMsandalsoahigh-capex-ledsupplygrowthfrom2H18-2019onwards,weforeseetheDRAMcontributiontoBOMstabilizingatahigh-teenpercentafterhittingapeakin2018of17%forlow-endand11%formid-rangesmartphones.Inthecaseofservers,althoughthedemandforDRAMtendstoberelativelyinelastic,agrowingBOMpressure(21%currently)hasbeenaninhibitorforcontentgrowthindatacenters.Onacombinedbasis,bothtypesofmemory(DRAM+NAND)accountfor~mid-30%ofthetotalServerBOM.In2017,serverDRAMincreaseditsBOMsharefrom15%inJan-17to20%inDec-17onthebackof~50%ASPgrowth,whilethetotalmemoryBOMgrewfrom~29%to~35%overthesameperiod.Westartednoticingthesignsin4Q17intermsofaslower-than-expectedmigrationtoPurley(whichneedshigherDRAMsupport).Figure31:RAMcontentacrossdifferentsmartphonesegmentsFigure32:RAMas%oftotalBOMindifferentsmartphonesegmentsMB%Source:J.P.Morganestimates.Source:J.P.Morganestimates.Note:Tosimplifyanalysis,wehaveassumedafixedsmartphoneBOMfordifferentsegments($80low-end,$150formid-end,$250forhigh-end).Figure33:Memory(DRAM+NAND)BOMcontributioninserversFigure34:RAMas%oftotalBOMinaverageserver%%Source:J.P.Morganestimates.Assumingaconstantcontentof16GBRAM/1TBNANDSource:J.P.Morganestimates.Assumingprice/densityofothercomponentsremainingsame12
JJParkAsiaPacificEquityResearch(82-2)758-571720February2018jj.park@jpmorgan.comBOMcontributionpatternsinDT/NBPCAnotherkeyCEcategorythathasbeenfacinggrowingBOMburdenssince1Q16isDT+NBPC.AnalysisofthebelowtrendsshowsthattheBOMcontributionpercentoverthelastsevenquartershasgrownsteeplyfromalow-to-mid-single-digitpercenttoalow-teenpercentinbothsegments.AnotherthingwewouldliketohighlightfromthechartsbelowisthattheDRAMcostburdenhasgrownovertheperiod,irrespectiveofthelukewarmcontentgrowthenvironment,asmostOEMplayersresortedtoslowerspecupgradationandevenpossiblede-specing.Figure35:RAMBOMcontributioninDesktops(2014-18E)Figure36:RAMBOMcontributiontoNotebooks(2014-18E)MB,%%Source:J.P.Morganestimates.Source:J.P.Morganestimates.NANDmarketMarketgrowsevenasahealthysupplygrowthcatalyzesASPcorrectionAbalanceinsupply-demandfortheNANDmarkethaspersistedsince4Q17.In1Q18,aheadoftheChineseNewYear,weexpectaseasonalweaknessindemandwhichwillgrowbyalow-single-digitpercentandwouldbefullytakencareofbytheongoingsupplygrowth.Wearepencilinginaconsecutive40%growthinsupplyforboth2018and2019,whichinouropinionwouldcreateanenvironmentofASPcorrections.WebelievetheNANDmarketisdueforahigh-teen-percentASPcorrectionin2018;however,duetoahigherprice-elasticityandwiderapplicationbase,weexpectsmartphoneeMCPandSSDdensitytogrowandhelpadouble-digit-percentgrowthfortheNANDmarket.However,weforeseetheASPcorrectionintensifyingtoalow-30%levelin2019asthemarketentersanover-supplysituationandthiswouldcauseasingle-digit-percentshrinkageinthemarketdespitegrowingdemand.Basedontherecentguidancewewouldalsoliketohighlightameaningfulupwardrevisionof~21%toourcumulative2017-18NANDcapexestimate,whichnowamountstoUS$57bn.Followinganaggressivecapex-ledcapacityexpansionforthepastthreeyears,wafergrowthshouldbeflatdueto2DcapacityreductionandindustryleaderssuchasSECallocatinghighercapacitytoDRAM.Sinceourguidanceforsupplygrowthisstillhealthyat40%(inlinewithcompanyguidance),modellingmid-30%demandgrowthin2018resultsinarelaxedsupplyscenarioleadingtoadequatesufficiencylevels.13
JJParkAsiaPacificEquityResearch(82-2)758-571720February2018jj.park@jpmorgan.comFigure37:NANDmarketsizeandblendedASPchange(yoy)Figure38:QuarterlyNANDmarketrevenueandyoychange(%)$(bn),%$(bn),%Source:WSTS,J.P.Morganestimates.Source:WSTS,J.P.Morganestimates.NANDSpotvsContractpricetrendsAftercorrecting11%(64GbTLC)and20%(128GbTLC)respectivelyfromtheirrespectivepeaklevelsinNovember,NANDpriceswerestableinJanuary.Aspotvscontract(company)pricingtrendforNANDindicatesthat,eventhoughNANDspotrateshavebeendecliningsince4Q17,contractpricesreportedbythecompaniesremainresilient.Figure39:NANDspotvscontract(company)pricingFigure40:QuarterlyNANDASPtrendmodelvscompany(%)%$/64Gbeq.Source:WSTS,J.P.Morganestimates.Source:CompanyData,J.P.Morganestimates.UpdateonNANDplayersThesaleofToshibaMemoryToshibaMemory(TMC)remainsontracktoexecutethesaleofitschipunitbusinesstotheBainledconsortiumbyendofMarch2018.ThefinalagreementwithWDallowsforjointroundsofinvestmentinconstructionofFab-6(Yokkaichi),whichwouldbededicatedtothemassproductionofBiCSFlash,thenextgenerationof3Dflashmemory.However,asignificanteventthatcouldimpactthesalewouldbetheantitrustscreeninginChina.Inthemostrecentdevelopment,Toshibaalsoraised¥600billioninfreshcapitalinDecemberviaaprivateplacementinvolvinganarrayofoverseasinvestors.This,combinedwiththesaleofU.S.unitWestinghouseElectricinJanuary,helpedmaintainthecompany’snetworthandpavesthewayforratingsupgradesandaboostinearnings.Duetoanimprovedfinancialstanding,TMCisnolongerundercriticalpressuretopursuethesaleofitschipunitanditcanalsopossiblytaketheIPOrouteincaseofafailuretoobtainregulatoryapproval.14
JJParkAsiaPacificEquityResearch(82-2)758-571720February2018jj.park@jpmorgan.comBreak-upofMicron-IntelJVforNANDmanufacturingTheIMFT(Intel–MicronFlashTechnologies)JV,whichbeganin2005foradevelopingNANDflashtechnology,wasbrokenupearlierthisyear.However,MicronandIntelwillstillbejointlyparticipatingonefinaltimetodevelopandmanufacture3DXPointbysharingtheUtahfacility.IntelwouldalsobedoublingitsmanufacturingcapacityinChina(Dalian)fab.WebelieveoneoftheobjectivesfortheJVsplitwastoundertakeadifferentprocesstechnologyformanufacturing.Beyondthenodewhichiscurrentlyunderdevelopment,weexpectMicrontoimplementachargetrap/ONOtechnologyforNANDproduction,whileIntelwouldoperateontheFloatingGate(OPO)technology.AmajorimpactofthisJVbreakupcouldcomeintermsofIntel"slicensingtheIPtechnologytoChinesememoryplayerssuchasYMTC,whichhasbeenlookingoutforIPrequiredtomanufacture3DNANDchips.SinceIntelconsumesmostofitsNANDoutputbyusingitinsideitsenterpriseSSDs,profitsfromIPlicensingcouldbecomeamotivation.Although,webelievethatMicronwouldbeinstrongoppositionofanysucharrangement,itcouldhaveadisruptiveimpactonthedynamicsoftheentireNANDmarketwhileposingathreattoother3DNANDplayerssuchasSamsung/Toshibabycreatingastateofoversupply.WhileIntelhasalreadystartedmanufacturingthenon-volatilesolutions(3DXPoint)inthe“Optane”categoryforPC’ssince2017,Micronwouldbetargetingserversusing“QuantX”technology.WithbothIntel/Microncompetinginthenon-volatilememorysolutionsspace,weforeseeanintensifyingcompetitioninthedata-centerspace.ChineseplayersentertheNANDsegmentAlthoughthemajorityofChineseplayersenteringthememoryindustryarefocusingonDRAM,YMTC,asubsidiaryofTsinghuaUnigrouphastakentheleadformanufacturingstoragesolutionssuchasmemorycardsandUSBdrives.IthasalsobeenmakingconsistenteffortsinthedirectionofsecuringIPfor3DNANDmanufacturing.AfteracquiringWuhanXinxinSemiconductorManufacturing(orXMC),thecompanytargetedtheconstructionofa300-mmfabtoproduce32-layer3DNANDwithatotalcapacityof100kwspm.However,withtheindustryleaderstransitioningto64/72layermainstreamproducts,webelieveChinaplayerswouldbeatalagof2-3generationsofprocesstechnology.Table2:InitialcapacitydetailsforChineseplayersCompanyProductCapacitywpmInvestment($bn)StartOperationYMTC(Tsinghua)DRAM100k4.43Q19YMTC(Tsinghua)3DNAND100k81Q19GigaDevice(Hefei)DRAM62k3.63Q19FujiaJinHuaDRAM60k51Q19Source:Companies.15
JJParkAsiaPacificEquityResearch(82-2)758-571720February2018jj.park@jpmorgan.comTable3:FocusareasforChinesememoryplayersCompanyFocusNANDsolutionsfordomesticlow-endproductslikeUSBdrivesandmemoryYMTC(Tsinghua)cards.PlanstoenterintotheSSDmarketaftergainingcompetitivenessinthe64/96layersolutionsGigaDevice(Hefei)MobileDRAMsolutionswithlow-powerrequirementsSpecialtyDRAMsolutionsinthedomesticmarketforConsumerElectronicsFujiaJinHuasegmentSource:Companies,J.P.MorganNANDdemandoutlookFor2018,weexpectstrongdemandgrowthfromSSDsandaslightly-weaker-than-expectedsmartphone/CENANDdemand(slowingDT+NBPCshipmentsandreducediPhonedemandforecasts)tobecomethemajordriversofthedemandoutlook.WeexpectthatasFlashdrivesandUSBdemandgraduallyfadesinthelongtermandsmartphonedemandstabilizes,SSDswillbetheleadingdemanddriver,accountingforahigh40%growthsequentiallybothin2018and2019.Inadditiontobeingafunctionoftheprice/GBlevel,SSDcontentgrowthinCE/Enterprisesegmentsisalsoastructuraltrend,asthemarketpreferstheperformance-relatedanddata-securitybenefitsassociatedwithSSDs.Unlikeinpreviousquarters,weforecastlesscyclicalityinquarterlydemandgoingforwardasSSDdemand(especiallydata-center-ledenterprisedemand)growsandcapturesagrowingdemandsharefromthesmartphonecategory.WeforecastSSDdemandtocontribute40%in2018andmid-40%in2019tooverallNANDdemand.Whilethesmartphone+tabletdemandwasaleadinggrowthdriverin2017,weexpectdemandgrowthfromthissegmenttofallonaccountofahighbaseeffect,downwardrevisionstoiPhonebuildforecasts,andreduceddemandgrowthfrommid-to-low-endcategoryduetohighNANDASPsuntil1H18.Figure41:NANDdemandbreakdownbyapplicationFigure42:NANDdemandgrowthbyapplication%%Source:Gartner,IDC,J.P.Morganestimates.Source:Gartner,IDC,J.P.Morganestimates.16
JJParkAsiaPacificEquityResearch(82-2)758-571720February2018jj.park@jpmorgan.comFigure43:ClientSSDshipmentsandyoygrowthtrendFigure44:EnterpriseSSDdemandgrowthtrendUnitinmn,%64Gbeq,%Source:IDC,J.P.Morganestimates.Source:IDC,J.P.Morganestimates.MeaningfulcontentgrowthfortheEnterprise/ClientSSDAscontentgrowthisafunctionofcost/bit,weareforecastingameaningfulupwardrevisioninSSDdensitiesfor2018.DuetosuppressedattachratesathigherASPlevelsin2017,contentgrowthintheclientSSDsegmentfor2018occursonalowerbase.HoweverenterpriseSSDcontentgrowthin2018islikelytobemorestructuralasSSDsgetwidelyadoptedacrossserversandnetwork-basedenterprisestorage.SSDsduetolowerlatencyandI/Operformanceandbetterdata-securityfeaturesarethepreferredenterprisestoragesolutions.For2018,wehavepenciledina~29%densitygrowthfortheenterprisesegmentafteramid-20%growthin2017.TheclientSSDdensityshouldaccelerateaswellto~19%afterasingle-digitratein2017.Weforecastshipmentsforbothcategoriestogrowby~20%in2018,butenterpriseSSDtocontributeahigher(~56%)proportionoftheoverallSSDmarketcomparedto~44%fortheclientsegment.Samsungmaintainsitsleadershippositioninboththeclient(44%marketshare)andenterprisesegments(41%marketshare)withbest-in-industryyieldsfor48/64layertechnology.Figure45:Densitygrowthvscost/GBreductionclientSSDFigure46:Densitygrowthvscost/GBreductionenterpriseSSDGB,USD/GBGB,USD/GBSource:IDC,J.P.Morganestimates.Source:IDC,J.P.Morganestimates.17
JJParkAsiaPacificEquityResearch(82-2)758-571720February2018jj.park@jpmorgan.comiPhoneimpactonoverallNANDdemandAsignificantproportion(approximatelyone-third)ofoverallsmartphonedemandconsistsoftheflashdemandfromiPhoneseveryyear.UsingourrevisediPhoneEMSbuildforecastsandassumingtheintroductionofa512GBvariantinadditionto64/256GBspecsforthe2018models,weforecast~31%demandgrowthin2H18comparedto2H17.However,wewouldliketohighlightthattheoverallcontributiontoNANDdemandfallsto13%in2H18Efrom14%in2H17,onaccountofagrowingSSDcontributionandlessincrementalNANDcontentgrowthforiPhonesin2018.Figure47:iPhoneNANDdemandtrendFigure48:iPhoneimpactontotalNANDdemandmn64Gbeq.%mn64Gbeq.%Source:J.P.Morganestimates.Source:J.P.Morganestimates.Figure49:EnterpriseSSDasa%ofvalueandvolumeofClientSSDFigure50:ClientandEnterpriseSSDgrowthrates%%Source:IDC,J.P.Morganestimates.Source:IDC,J.P.Morganestimates.Figure51:TotalSSDValuesharebykeycompaniesFigure52:EnterpriseSSDValuesharebykeycompanies%%Source:IDC,J.P.Morganestimates.Source:IDC,J.P.Morganestimates.18
JJParkAsiaPacificEquityResearch(82-2)758-571720February2018jj.park@jpmorgan.comStockimplicationsAfterthestrongsharepricerallythroughout2017,allmemorystockshavebeenrange-boundYTDasmemorypricemomentumslowsdownandthemarketbeginstolookbeyondthe2018cycleamidnewcapacityannouncements.Althoughmostmemorystocksappearattractivefromavaluationstandpoint,webelievethereneedstobeacatalyst(e.g.anotherlegofmemorypriceappreciation)todrivethestockshigher.Hence,wepreferSPEsoverchipmakersgivenongoingcapexhikes.Amidthehigh-capexenvironmentandattemptstoachievethedesiredbit-growthafteraccountingforwaferlosses,semi-equipmentmanufacturerssuchasAdvantest(DRAMrelated)andUlvac(3DXpointrelated)shouldbethebeneficiaries.AmongSPEnamesintheEU/US,welikeASML(EUVequipment),AppliedMaterials(AMAT),KLATencor(KLAC)andLamResearch(LRCX).Figure53:DRAMstocksvs.DRAMrevenue(1Q-ahead)Figure54:DRAMstocksvs.DRAMASPyoy(1Q-ahead)trend$(bn),$(bn)$(bn),%Source:Bloomberg,WSTS,J.P.Morganestimates.Note:CustomindexisdefinedasthesumSource:Bloomberg,Companydata,J.P.Morganestimates.Note:Customindexisdefinedasof$-denominatedmarketcapofSKhynixandMicron.thesumof$-denominatedmarketcapofSKhynixandMicron.Figure55:SharepriceperformanceofkeymemoryplayersFigure56:One-yearsharepriceperformanceofkeymemoryplayers%%Source:Bloomberg,J.P.Morgan.Note:Pastperformanceisnotanindicatoroffuturereturns.Source:Bloomberg,J.P.Morgan.Note:Pastperformanceisnotanindicatoroffuturereturns.Table4:Valuationcomparison:KeymemoryplayersPriceMkt.cap.P/E(x)P/BV(x)ROE(%)CompanyTickerJPMRating(LC)$(bn)FY1EFY2EFY1EFY2EFY1EFY2EYTDSamsung005930KSOW2,450,000292,6867.06.91.31.120.117.2-4.4SKhynix000660KSN77,60052,4604.24.81.21.033.221.90.7MicronMUUSOW4451,1214.44.91.71.247.227.27.5WDCWDCUSNC8525,2666.16.82.01.735.828.76.8Toshiba6502JTOW31019,0383.712.24.01.2NA13.5-1.9Source:Bloomberg,J.P.Morgan.Bloombergconsensusestimates.PricesasofFeb19close.19
JJParkAsiaPacificEquityResearch(82-2)758-571720February2018jj.park@jpmorgan.comKeyendmarketassumptionsShipments(M)1Q172Q173Q174Q171Q18E2Q18E3Q18E4Q18E20142015201620172018E2019EDesktop24272726222426241341181081039693Notebooks3743504337424644180169166173170169Servers33333333101211121212Totalhandset4514444884764524584984871,9101,9661,8891,8581,8941,897Smartphones3723714204133883974404311,2451,4241,5021,5761,6561,687FeaturePhones7973686363615856665542387283238209Tablets3637414936363845230196170162154154Source:Gartner,IDC,J.P.Morganestimates.DRAMmodelGlobalDRAMsupply-demandmodel2Gb.equivalent1Q172Q173Q174Q171Q18E2Q18E3Q18E4Q18E201620172018E2019ETotaldemand(Munits)10,16011,14212,15712,35812,33113,36614,32514,63937,79045,81654,66167,005Sequentialgrowth(%)-2%10%9%2%0%8%7%2%32%21%19%23%Y/Ygrowth(%)25%22%20%19%21%20%18%18%Totalsupply(Munits)10,30210,81311,87012,21312,36013,05914,30715,01437,71045,19854,74168,206Sequentialgrowth(%)-6%5%10%3%1%6%10%5%32%20%21%25%Y/Ygrowth(%)38%23%14%11%20%21%21%23%Consumption(WSTS)10,46110,76012,06612,22112,34513,21314,31614,82738,01045,50854,70167,605Sequentialgrowth(%)-8%3%12%1%1%7%8%4%40%20%20%24%Y/Ygrowth(%)41%22%15%8%18%23%19%21%Inventorybuild-up-53--15--188--40601Cumulativeinventory--27--7--1011--Sufficiencyexinventory(%)-2%0%-2%0%0%-1%0%1%-1%-1%0%1%Sufficiency(%)-2%0%-1%0%0%-1%0%1%-1%-1%0%1%DRAMRevenues(US$,M)14,37816,57519,98621,86422,88824,77423,15120,42641,17972,80291,23871,553Sequentialgrowth(%)13%15%21%9%5%8%-7%-12%-8%77%25%-22%Y/Ygrowth(%)68%80%86%72%59%49%16%-7%DRAMASP($)1.371.541.661.791.851.881.621.381.081.601.671.06Sequentialgrowth(%)23%12%8%8%4%1%-14%-15%-34%48%4%-37%Y/Ygrowth(%)19%48%61%60%35%22%-2%-23%Source:Gartner,WSTS,J.P.Morganestimates.DRAMdemandmodel2Gb.equivalent(millions)1Q172Q173Q174Q171Q18E2Q18E3Q18E4Q18E201620172018E2019EPCDRAM2,6032,7062,9403,1472,6772,7573,1583,31810,43111,39611,91012,930Desktop4625095155414614785205441,9742,0272,0032,127Notebooks8209671,1181,0498961,0221,1331,1093,5143,9554,1604,524Upgrades&otherEDP1,3211,2301,3061,5571,3201,2571,5051,6654,9445,4145,7466,279Server1,9662,1272,4232,5512,6982,9193,1903,4476,3219,06712,25416,381MobileDRAM3,7914,3325,0125,0294,7665,3395,7715,73614,95418,16421,61226,744Others1,5161,5621,5951,8021,8731,9512,0462,1445,3996,4768,0139,918ConsumerElectronics9311,0571,0971,1351,1541,2161,2811,3443,3674,2214,9946,097AutomotiveElectronics4346505355586164146192237292IndustrialElectronics4653963885325805906256421,6161,7812,4363,105Military/CivilAerospace7664618184887995270282346424Total9,87610,72711,97012,53012,01312,96614,16514,64537,10645,10353,78965,972Source:Gartner,J.P.Morganestimates.20
JJParkAsiaPacificEquityResearch(82-2)758-571720February2018jj.park@jpmorgan.comDRAMdensityassumptionsMB1Q172Q173Q174Q171Q18E2Q18E3Q18E4Q18E201620172018E2019EDesktops4,8544,8904,9475,4145,2655,1265,2015,7344,6815,0265,3325,828Notebooks5,6135,7325,7746,2566,2006,2006,2556,3915,4135,8486,2656,857Servers188,320189,425203,607214,069232,783250,187270,810289,779141,152199,339261,100338,628Smartphones2,0102,2692,4872,6892,4572,7312,8372,8162,0212,3762,7173,383Lowend1,8092,0192,2202,3992,1352,3552,4622,4211,8122,1172,3502,938Midend1,9952,2272,5372,6042,4742,7282,8532,8062,0782,3572,7163,395Highend2,6602,9703,1723,4273,3903,7373,9083,8442,5813,0923,7354,601Tablets2,6252,5502,5682,5852,9792,9872,9963,0052,3502,5822,9933,549Featurephones339350357367382401421442307352411540Source:Gartner,J.P.Morganestimates.DRAMsupplymodel2Gb.Equivalent(millions)1Q172Q173Q174Q171Q18E2Q18E3Q18E4Q18E20162017E2018E2019ESKhynix2,8032,8733,3473,4513,3473,5143,9714,0919,93712,47314,92418,014Samsung4,7595,0925,5505,7165,8316,1226,6736,87418,25221,11725,50031,604Micron2,2822,3822,5002,5522,6782,8573,0293,3277,6849,71611,89014,874Nanya2572622692973123463884361,0811,0851,4832,165Powerchip132133130132116140144148470527548676Others707274657779101139285280397872Total10,30210,81311,87012,21312,36013,05914,30715,01437,71045,19854,74168,206Industrysupplygrowth(%)*-6%5%10%3%1%6%10%5%32%20%21%25%Source:IHS,Companydata,J.P.Morganestimates.*Note:Sequentialgrowthratespresentedhere.DRAMcapexbycompany(US$mn)2005200620072008200920102011201220132014201520162017E2018ESKhynix2,4003,4004,0001,6006002,2002,2501,7001,8003,7003,5003,8004,0007,300Samsung3,2103,5004,8003,5001,9003,4622,2572,6633,1986,6465,7733,4518,14211,402Micron1,5001,4001,1001,6504006007207007002,3002,0002,1002,8003,800Elpida1,7001,3001,400900420740950300350-----Inotera9001,4001,3006253501,9004001502157251,660900Nanya1201501,430380380790374681891911807001,8001,500Winbond700670250200802452155035200125125450450Powerchip1,3001,7001,900630200350350502525175405050ProMOS5208401,8006002511010025------Rexchip--2,000200300450310100200-----Others1,1601,1201,120490----------Total13,51015,48021,10010,7754,65510,8477,9275,8056,71213,78713,41311,11617,24224,502Change,%25%15%36%-49%-57%133%-27%-27%16%105%-3%-17%55%42%Source:IHS,Companydata,J.P.Morganestimates.21
JJParkAsiaPacificEquityResearch(82-2)758-571720February2018jj.park@jpmorgan.comGlobalmDRAMmodelGlobalmDRAMmodel2Gb.equivalent1Q172Q173Q174Q171Q18E2Q18E3Q18E4Q18E201620172018E2019ETotaldemand(M)3,7914,3325,0125,0294,7665,3395,7715,73614,95418,16421,61226,744Sequentialgrowth(%)-8%14%16%0%-5%12%8%-1%44%21%19%24%Y/Ygrowth(%)20%20%24%22%26%23%15%14%Totalsupply(M)4,1094,1034,8165,1134,8685,3836,0716,53715,23218,14122,85928,339Sequentialgrowth(%)-15%0%17%6%-5%11%13%8%50%19%26%24%Y/Ygrowth(%)56%21%10%6%18%31%26%28%TotalConsumption4,0694,3445,0615,2234,9615,5226,0996,32115,54618,69722,90228,367Sequentialgrowth(%)-12%7%17%3%-5%11%10%4%47%20%22%24%Y/Ygrowth(%)36%20%17%13%22%27%20%21%Revenues(US$,M)5,6326,0637,4768,8788,6859,3769,0107,84417,94428,04834,91528,217Sequentialgrowth(%)-6%8%23%19%-2%8%-4%-13%3%56%24%-19%Y/Ygrowth(%)53%60%67%48%54%55%21%-12%mDRAMASP(2Gb.Eq.)1.381.401.481.701.751.701.481.241.151.501.520.99Sequentialgrowth(%)7%1%6%15%3%-3%-13%-16%-30%30%2%-35%Y/Ygrowth(%)12%33%43%31%26%22%0%-27%BlendedDRAMASP(2Gb.Eq.)1.371.541.661.791.851.881.621.381.081.601.671.06mDRAMpremium1%-9%-11%-5%-6%-9%-9%-10%7%-6%-9%-6%Inventory40------216----Cumulativeinventory10620------413--Sufficiency(Exinventory)1%-6%-5%-2%-2%-3%0%3%-2%-3%0%0%Sufficiency(%)4%-5%-5%-2%-2%-3%0%3%-2%-3%0%0%Source:IHS,Companydata,J.P.Morganestimates.mDRAMdemandmodel2Gb.Equivalent(millions)1Q172Q173Q174Q171Q18E2Q18E3Q18E4Q18E201620172018E2019ESmartphones2,9173,2874,0824,3363,7274,2344,8764,74211,86014,62317,57922,299Lowend1,5751,6092,0412,1281,8302,0442,4542,2846,4897,3548,61310,821Midend6087751,0008829209731,0791,0542,1923,2644,0255,349Highend7349041,0411,3269771,2171,3431,4053,1794,0054,9426,129Tablets3683684074944164184395321,5591,6371,8062,134FeaturePhones105100949095959696463389381441Others2712963103293523703723788501,2051,4721,747Total3,6614,0524,8935,2494,5905,1175,7825,74914,73317,85421,23826,621Source:J.P.MorganmDRAMsupplymodel2Gb.Equivalent(millions)1Q172Q173Q174Q171Q18E2Q18E3Q18E4Q18E201620172018E2019ESKhynix9609001,2721,3801,1711,3461,5961,7144,0194,5125,8286,960Samsung2,2752,2682,4422,5952,6242,8373,0923,2378,2229,58011,79114,762Micron8038601,0121,0449691,0741,2271,3942,7783,7194,6645,762Others71759094104126155192212330576855Total4,1094,1034,8165,1134,8685,3836,0716,53715,23218,14122,85928,339Industrysupplygrowth(%)*-15%0%17%6%-5%11%13%8%50%19%26%24%Source:IHS,Companydata,J.P.Morganestimates.*Note:Sequentialgrowthratespresentedhere.22
JJParkAsiaPacificEquityResearch(82-2)758-571720February2018jj.park@jpmorgan.comGlobalNANDmodelGlobalNANDsupply-demandmodel64Gb.equivalent1Q172Q173Q174Q17E1Q18E2Q18E3Q18E4Q18E20162017E2018E2019EDemand(M)5,2295,4405,7226,1826,3777,0738,0858,75916,86522,57330,29541,257Sequentialchange(%)2%4%5%8%3%11%14%8%44%34%34%36%Y/Ychange(%)53%42%27%21%22%30%41%42%Supply(M)4,7295,1615,8376,4116,5937,1908,2089,01716,74422,13731,00842,999Sequentialchange(%)-3%9%13%10%3%9%14%10%45%32%40%39%Y/Ychange(%)37%33%29%31%39%39%41%41%Consumption(M)4,7095,2345,8586,4646,4857,1328,1478,88816,84022,26430,65142,128Sequentialchange(%)-5%11%12%10%0%10%14%9%48%32%38%37%Y/Ychange(%)35%37%29%30%38%36%39%38%Inventorybuild-up20---1085962129--357871Cumulativeinventorybuildup-10---54293114---Sufficiency(exinventory)0%-1%0%-1%2%1%1%1%-1%-1%1%2%Sufficiency(incl.inventory)0%-1%0%-1%2%2%1%2%0%-1%1%2%NANDrevenues(US$,M)10,47112,37513,98315,39914,98614,99714,90513,82132,13352,22758,70953,778Sequentialchange(%)5%18%13%10%-3%0%-1%-7%11%63%12%-8%Y/Ychange(%)50%79%68%55%43%21%7%-10%NANDASP(US$.)2.222.362.392.382.312.101.831.561.912.351.921.28Sequentialchange(%)11%6%1%0%-3%-9%-13%-15%-25%23%-18%-33%Y/Ychange(%)11%31%31%19%4%-11%-23%-35%Source:IHS,Companydata,J.P.Morganestimates.NANDdemandmodel64Gb.Equivalent(millions)1Q172Q173Q174Q17E1Q18E2Q18E3Q18E4Q18E20162017E2018E2019EUSB4294243673735485274324301,2621,5931,9362,209Flashcards6656724604996606776386392,1602,2972,6142,924SSDs1,9032,1722,0012,0112,1312,5683,1973,9435,8908,08711,83917,577Smartphones1,4671,4341,8932,4101,9972,0862,4502,7294,5137,2049,26212,250Tablets2162292503252562792994158241,0201,2491,722Featurephones4444443320161414Others4524795185595896216757091,5872,0072,5943,486Total5,1365,4155,4926,1816,1846,7637,6948,86716,25622,22329,50840,181Source:IDC,Gartner,J.P.Morganestimates.NANDcontentassumptionsMB1Q172Q173Q174Q17E1Q18E2Q18E3Q18E4Q18E20162017E2018E2019EUSB42,29742,36432,85733,53052,66252,68543,47143,14729,19337,52948,04962,829FlashCards32,62636,96826,15328,21441,68543,62935,11637,07124,60731,09739,15851,384SSDs384,036398,369368,178329,495381,445414,689468,983510,045310336368,503449,688581,247ClientSSD291,840286,720264,192237,773259,172287,681327,957377,150249630267,293316,979408,422Enterpr.SSD1239040124280112640011376641251430140160215978261805544954852118452615242162011510Smartphone32,35031,66436,89247,82442,12543,06445,62051,84224,60937,45545,80859,473Lowend17,44216,23819,82524,14022,43022,16024,02325,56812,73219,50723,60729,149Midend29,07027,06433,04240,23437,38336,93340,03842,61321,33832,42539,27848,436Highend83,05677,32489,301108,741106,808105,522114,394129,13261,94490,967114,629156,365Tablets49,27250,81650,54454,45358,54563,76865,32774,95439,72351,50466,22091,635Lowend20,98321,82222,15022,59323,49624,43626,39128,76618,27621,95125,92132,198Midend40,25341,86342,49143,34145,50847,78351,60656,25135,19342,14850,91865,430Highend87,74993,01498,130102,055107,158116,802128,482143,90073,99195,669124,845172,614FeaturePh.447456461466470480489499427457484530Source:IDC,J.P.Morganestimates.23
JJParkAsiaPacificEquityResearch(82-2)758-571720February2018jj.park@jpmorgan.comNANDsupplymodel64Gb.Equivalent(millions)1Q172Q173Q174Q17E1Q18E2Q18E3Q18E4Q18E20162017E2018E2019ESKhynix5595226047036897929351,0192,0382,3883,4344,821Samsung1,7691,8932,1582,3742,3742,6593,0583,3646,5218,19511,45516,240Micron+Intel6987598108469101,0141,2051,3212,0593,1124,4506,538Toshiba9471,0701,2191,3881,4771,4861,6711,7873,4454,6256,4218,148SanDisk7529131,0421,0961,1381,2331,3311,5122,6703,8035,2147,180Others33445691410143573Total4,7295,1615,8376,4116,5937,1908,2089,01716,74422,13731,00842,999Industrybitgrowth(%)*-3%9%13%10%3%9%14%10%45%32%40%39%Source:Companydata,iSuppli,J.P.Morganestimates.*Note:Sequentialgrowthratespresentedhere.NANDcapexbycompany(US$mn)2005200620072008200920102011201220132014201520162017E2018ESKhynix-1,0009505001508007502,0001,1001,1001,4001,6004,6735,890Samsung2,0003,0003,5003,3001,1003,6363,1602,8403,6553,3234,1745,1769,7357,477Micron-1,1002,3002,3004007001,8001,1009501,3001,5003,1002,7003,850Intel-----------1,6002,5003,500Toshiba+SanDisk3,2003,0003,5003,7001,0002,6003,5002,4002,1502,5003,5003,7005,0006,230Others2,5003,000Total5,3308,23010,4009,9002,6807,7369,2108,3407,8558,22310,57415,17627,10829,947Change(%)65%54%26%-5%-73%189%19%-9%-6%5%29%44%79%10%Source:iSuppli,Companydata,J.P.Morganestimates.24
JJParkAsiaPacificEquityResearch(82-2)758-571720February2018jj.park@jpmorgan.comCorrectedNote:Twonamesaddedtolastbulletofcoverpageand2ndparagraphofpg19.Table4:WDCcorrectedtoNC.CompaniesDiscussedinThisReport(allpricesinthisreportasofmarketcloseon19February2018,unlessotherwiseindicated)ASML(ASML.AS/€155.80[16February2018]/Overweight),Advantest(6857)(6857.T/¥2224/Overweight),AppliedMaterials(AMAT/$55.03[16February2018]/Overweight),ULVAC(6728)(6728.T/¥6390/Overweight)AnalystCertification:Theresearchanalyst(s)denotedbyan“AC”onthecoverofthisreportcertifies(or,wheremultipleresearchanalystsareprimarilyresponsibleforthisreport,theresearchanalystdenotedbyan“AC”onthecoverorwithinthedocumentindividuallycertifies,withrespecttoeachsecurityorissuerthattheresearchanalystcoversinthisresearch)that:(1)alloftheviewsexpressedinthisreportaccuratelyreflecthisorherpersonalviewsaboutanyandallofthesubjectsecuritiesorissuers;and(2)nopartofanyoftheresearchanalyst"scompensationwas,is,orwillbedirectlyorindirectlyrelatedtothespecificrecommendationsorviewsexpressedbytheresearchanalyst(s)inthisreport.ForallKorea-basedresearchanalystslistedonthefrontcover,theyalsocertify,asperKOFIArequirements,thattheiranalysiswasmadeingoodfaithandthattheviewsreflecttheirownopinion,withoutundueinfluenceorintervention.ImportantDisclosuresMarketMaker:JPMSmakesamarketinthestockofAppliedMaterials.MarketMaker/LiquidityProvider:J.P.MorganSecuritiesplcand/oranaffiliateisamarketmakerand/orliquidityproviderinsecuritiesissuedbyAdvantest(6857),ASML,AppliedMaterials,ULVAC(6728).LeadorCo-manager:J.P.Morganactedasleadorco-managerinapublicofferingofequityand/ordebtsecuritiesforAppliedMaterialswithinthepast12months.Client:J.P.Morgancurrentlyhas,orhadwithinthepast12months,thefollowingentity(ies)asclients:Advantest(6857),ASML,AppliedMaterials.Client/InvestmentBanking:J.P.Morgancurrentlyhas,orhadwithinthepast12months,thefollowingentity(ies)asinvestmentbankingclients:AppliedMaterials.Client/Non-InvestmentBanking,Securities-Related:J.P.Morgancurrentlyhas,orhadwithinthepast12months,thefollowingentity(ies)asclients,andtheservicesprovidedwerenon-investment-banking,securities-related:Advantest(6857),ASML,AppliedMaterials.Client/Non-Securities-Related:J.P.Morgancurrentlyhas,orhadwithinthepast12months,thefollowingentity(ies)asclients,andtheservicesprovidedwerenon-securities-related:ASML,AppliedMaterials.InvestmentBanking(past12months):J.P.Morganreceivedinthepast12monthscompensationforinvestmentbankingservicesfromAppliedMaterials.InvestmentBanking(next3months):J.P.Morganexpectstoreceive,orintendstoseek,compensationforinvestmentbankingservicesinthenextthreemonthsfromAppliedMaterials.Non-InvestmentBankingCompensation:J.P.Morganhasreceivedcompensationinthepast12monthsforproductsorservicesotherthaninvestmentbankingfromAdvantest(6857),ASML,AppliedMaterials.OtherSignificantFinancialInterests:J.P.Morganownsapositionof1millionUSDormoreinthedebtsecuritiesofAdvantest(6857),ASML,AppliedMaterials,ULVAC(6728).Gartner:AllstatementsinthisreportattributabletoGartnerrepresentJ.P.Morgan"sinterpretationofdataopinionorviewpointspublishedaspartofasyndicatedsubscriptionservicebyGartner,Inc.,andhavenotbeenreviewedbyGartner.EachGartnerpublicationspeaksasofitsoriginalpublicationdate(andnotasofthedateofthisreport).TheopinionsexpressedinGartnerpublicationsarenotrepresentationsoffact,andaresubjecttochangewithoutnotice.Company-SpecificDisclosures:Importantdisclosures,includingpricechartsandcreditopinionhistorytables,areavailableforcompendiumreportsandallJ.P.Morgan–coveredcompaniesbyvisitinghttps://www.jpmm.com/research/disclosures,calling1-800-477-0406,ore-mailingresearch.disclosure.inquiries@jpmorgan.comwithyourrequest.J.P.Morgan’sStrategy,Technical,andQuantitativeResearchteamsmayscreencompaniesnotcoveredbyJ.P.Morgan.Forimportantdisclosuresforthesecompanies,pleasecall1-800-477-0406ore-mailresearch.disclosure.inquiries@jpmorgan.com.25
JJParkAsiaPacificEquityResearch(82-2)758-571720February2018jj.park@jpmorgan.comAdvantest(6857)(6857.T,6857JT)PriceChart4,4523,8163,180OWY3,0002,544Price(Y)DateRatingSharePricePriceTarget1,908(Y)(Y)19-Apr-17OW192630001,2726360FebMayAugNovFebMayAugNovFebMayAugNovFeb15151515161616161717171718Source:BloombergandJ.P.Morgan;pricedataadjustedforstocksplitsanddividends.InitiatedcoverageApr26,2001.BreakincoverageJul31,2015-Apr19,2017.ASML(ASML.AS,ASMLNA)PriceChart273234195OW€125OW€114OW€140OW€175OW€180DateRatingSharePricePriceTarget(€)(€)156Price(€)19-Mar-15OW100.55125.0011729-Sep-15OW74.12114.0019-Jan-17OW114.40140.007828-Sep-17OW141.05175.0018-Jan-18OW166.60180.00390FebMayAugNovFebMayAugNovFebMayAugNovFeb15151515161616161717171718Source:BloombergandJ.P.Morgan;pricedataadjustedforstocksplitsanddividends.InitiatedcoverageDec11,2001.26
JJParkAsiaPacificEquityResearch(82-2)758-571720February2018jj.park@jpmorgan.comAppliedMaterials(AMAT,AMATUS)PriceChartOW$25OW$32OW$42OW$70DateRatingSharePricePriceTarget90($)($)15-May-15OW20.2028.00OW$26OW$27OW$38OW$5612-Aug-15OW17.3426.007214-Aug-15OW16.6425.00OW$28OW$23OW$24OW$36OW$5313-Oct-15OW15.1423.00Price($)5419-Feb-16OW18.3824.0020-May-16OW22.6627.003619-Aug-16OW29.6432.0018-Nov-16OW30.7436.0020-Dec-16OW32.6138.001816-Feb-17OW35.1842.0019-May-17OW43.9153.00018-Aug-17OW44.3056.00FebMayAugNovFebMayAugNovFebMayAugNovFeb1515151516161616171717171817-Nov-17OW56.4970.00Source:BloombergandJ.P.Morgan;pricedataadjustedforstocksplitsanddividends.InitiatedcoverageNov07,2002.ULVAC(6728)(6728.T,6728JT)PriceChart13,86011,550NY2,300OWY7,500OWY9,7009,240DateRatingSharePricePriceTargetPrice(Y)6,930(Y)(Y)15-May-15N208223004,62024-Jul-17OW5960750013-Nov-17OW857097002,3100FebMayAugNovFebMayAugNovFebMayAugNovFeb15151515161616161717171718Source:BloombergandJ.P.Morgan;pricedataadjustedforstocksplitsanddividends.InitiatedcoverageOct06,2004.BreakincoverageJul31,2015-Jul24,2017.Thechart(s)showJ.P.Morgan"scontinuingcoverageofthestocks;thecurrentanalystsmayormaynothavecovereditovertheentireperiod.J.P.Morganratingsordesignations:OW=Overweight,N=Neutral,UW=Underweight,NR=NotRatedExplanationofEquityResearchRatings,DesignationsandAnalyst(s)CoverageUniverse:J.P.Morganusesthefollowingratingsystem:Overweight[Overthenextsixtotwelvemonths,weexpectthisstockwilloutperformtheaveragetotalreturnofthestocksintheanalyst’s(ortheanalyst’steam’s)coverageuniverse.]Neutral[Overthenextsixtotwelvemonths,weexpectthisstockwillperforminlinewiththeaveragetotalreturnofthestocksintheanalyst’s(ortheanalyst’steam’s)coverageuniverse.]Underweight[Overthenextsixtotwelvemonths,weexpectthisstockwillunderperformtheaveragetotalreturnofthestocksintheanalyst’s(ortheanalyst’steam’s)coverageuniverse.]NotRated(NR):J.P.Morganhasremovedtheratingand,ifapplicable,thepricetarget,forthisstockbecauseofeitheralackofasufficientfundamentalbasisorforlegal,regulatoryorpolicyreasons.Thepreviousratingand,ifapplicable,thepricetarget,nolongershouldbereliedupon.AnNRdesignationisnotarecommendationorarating.InourAsia(ex-Australiaandex-India)andU.K.small-andmid-capequityresearch,eachstock’sexpectedtotalreturniscomparedtotheexpectedtotalreturnofabenchmarkcountrymarketindex,nottothoseanalysts’coverageuniverse.IfitdoesnotappearintheImportantDisclosuressectionofthisreport,thecertifyinganalyst’scoverageuniversecanbefoundonJ.P.Morgan’sresearchwebsite,www.jpmorganmarkets.com.27
JJParkAsiaPacificEquityResearch(82-2)758-571720February2018jj.park@jpmorgan.comCoverageUniverse:Park,JJ:LGElectronics(066570.KS),Panasonic(6752)(6752.T),SKhynix(000660.KS),SamsungElectronics(005930.KS),Sony(6758)(6758.T)J.P.MorganEquityResearchRatingsDistribution,asofJanuary02,2018OverweightNeutralUnderweight(buy)(hold)(sell)J.P.MorganGlobalEquityResearchCoverage45%43%12%IBclients*53%50%35%JPMSEquityResearchCoverage44%46%10%IBclients*70%66%54%*Percentageofinvestmentbankingclientsineachratingcategory.ForpurposesonlyofFINRA/NYSEratingsdistributionrules,ourOverweightratingfallsintoabuyratingcategory;ourNeutralratingfallsintoaholdratingcategory;andourUnderweightratingfallsintoasellratingcategory.PleasenotethatstockswithanNRdesignationarenotincludedinthetableabove.EquityValuationandRisks:Forvaluationmethodologyandrisksassociatedwithcoveredcompaniesorpricetargetsforcoveredcompanies,pleaseseethemostrecentcompany-specificresearchreportathttp://www.jpmorganmarkets.com,contacttheprimaryanalystoryourJ.P.Morganrepresentative,oremailresearch.disclosure.inquiries@jpmorgan.com.Formaterialinformationabouttheproprietarymodelsused,pleaseseetheSummaryofFinancialsincompany-specificresearchreportsandtheCompanyTearsheets,whichareavailabletodownloadonthecompanypagesofourclientwebsite,http://www.jpmorganmarkets.com.Thisreportalsosetsoutwithinitthematerialunderlyingassumptionsused.EquityAnalysts"Compensation:Theequityresearchanalystsresponsibleforthepreparationofthisreportreceivecompensationbaseduponvariousfactors,includingthequalityandaccuracyofresearch,clientfeedback,competitivefactors,andoverallfirmrevenues.Registrationofnon-USAnalysts:Unlessotherwisenoted,thenon-USanalystslistedonthefrontofthisreportareemployeesofnon-USaffiliatesofJPMS,arenotregistered/qualifiedasresearchanalystsunderNASD/NYSErules,maynotbeassociatedpersonsofJPMS,andmaynotbesubjecttoFINRARule2241restrictionsoncommunicationswithcoveredcompanies,publicappearances,andtradingsecuritiesheldbyaresearchanalystaccount.OtherDisclosuresJ.P.Morgan("JPM")istheglobalbrandnameforJ.P.MorganSecuritiesLLC("JPMS")anditsaffiliatesworldwide.J.P.MorganCazenoveisamarketingnamefortheU.K.investmentbankingbusinessesandEMEAcashequitiesandequityresearchbusinessesofJPMorganChase&Co.anditssubsidiaries.Allresearchreportsmadeavailabletoclientsaresimultaneouslyavailableonourclientwebsite,J.P.MorganMarkets.Notallresearchcontentisredistributed,e-mailedormadeavailabletothird-partyaggregators.Forallresearchreportsavailableonaparticularstock,pleasecontactyoursalesrepresentative.Optionsrelatedresearch:Iftheinformationcontainedhereinregardsoptionsrelatedresearch,suchinformationisavailableonlytopersonswhohavereceivedtheproperoptionriskdisclosuredocuments.ForacopyoftheOptionClearingCorporation"sCharacteristicsandRisksofStandardizedOptions,pleasecontactyourJ.P.MorganRepresentativeorvisittheOCC"swebsiteathttps://www.theocc.com/components/docs/riskstoc.pdfLegalEntitiesDisclosuresU.S.:JPMSisamemberofNYSE,FINRA,SIPCandtheNFA.JPMorganChaseBank,N.A.isamemberofFDIC.U.K.:JPMorganChaseN.A.,LondonBranch,isauthorisedbythePrudentialRegulationAuthorityandissubjecttoregulationbytheFinancialConductAuthorityandtolimitedregulationbythePrudentialRegulationAuthority.DetailsabouttheextentofourregulationbythePrudentialRegulationAuthorityareavailablefromJ.P.Morganonrequest.J.P.MorganSecuritiesplc(JPMSplc)isamemberoftheLondonStockExchangeandisauthorisedbythePrudentialRegulationAuthorityandregulatedbytheFinancialConductAuthorityandthePrudentialRegulationAuthority.RegisteredinEngland&WalesNo.2711006.RegisteredOffice25BankStreet,London,E145JP.SouthAfrica:J.P.MorganEquitiesSouthAfricaProprietaryLimitedisamemberoftheJohannesburgSecuritiesExchangeandisregulatedbytheFinancialServicesBoard.HongKong:J.P.MorganSecurities(AsiaPacific)Limited(CEnumberAAJ321)isregulatedbytheHongKongMonetaryAuthorityandtheSecuritiesandFuturesCommissioninHongKongand/orJ.P.MorganBroking(HongKong)Limited(CEnumberAAB027)isregulatedbytheSecuritiesandFuturesCommissioninHongKong.Korea:ThismaterialisissuedanddistributedinKoreabyorthroughJ.P.MorganSecurities(FarEast)Limited,SeoulBranch,whichisamemberoftheKoreaExchange(KRX)andisregulatedbytheFinancialServicesCommission(FSC)andtheFinancialSupervisoryService(FSS).Australia:J.P.MorganAustraliaLimited(JPMAL)(ABN52002888011/AFSLicenceNo:238188)isregulatedbyASICandJ.P.MorganSecuritiesAustraliaLimited(JPMSAL)(ABN61003245234/AFSLicenceNo:238066)isregulatedbyASICandisaMarket,ClearingandSettlementParticipantofASXLimitedandCHI-X.Taiwan:J.P.MorganSecurities(Taiwan)LimitedisaparticipantoftheTaiwanStockExchange(company-type)andregulatedbytheTaiwanSecuritiesandFuturesBureau.India:J.P.MorganIndiaPrivateLimited(CorporateIdentityNumber-U67120MH1992FTC068724),havingitsregisteredofficeatJ.P.MorganTower,Off.C.S.T.Road,Kalina,Santacruz-East,Mumbai–400098,isregisteredwithSecuritiesandExchangeBoardofIndia(SEBI)asa‘ResearchAnalyst’havingregistrationnumberINH000001873.J.P.MorganIndiaPrivateLimitedisalsoregisteredwithSEBIasamemberoftheNationalStockExchangeofIndiaLimited(SEBIRegistrationNumber-INB230675231/INF230675231/INE230675231),theBombayStockExchangeLimited(SEBIRegistrationNumber-INB010675237/INF010675237)andasaMerchantBanker(SEBIRegistrationNumber-MB/INM000002970).Telephone:91-22-61573000,Facsimile:91-22-61573990andWebsite:www.jpmipl.com.Fornonlocalresearchreports,thismaterialisnotdistributedinIndiabyJ.P.MorganIndiaPrivateLimited.Thailand:ThismaterialisissuedanddistributedinThailandbyJPMorganSecurities(Thailand)Ltd.,whichisamemberoftheStockExchangeof28
JJParkAsiaPacificEquityResearch(82-2)758-571720February2018jj.park@jpmorgan.comThailandandisregulatedbytheMinistryofFinanceandtheSecuritiesandExchangeCommissionanditsregisteredaddressis3rdFloor,20NorthSathornRoad,Silom,Bangrak,Bangkok10500.Indonesia:PTJ.P.MorganSecuritiesIndonesiaisamemberoftheIndonesiaStockExchangeandisregulatedbytheOJKa.k.a.BAPEPAMLK.Philippines:J.P.MorganSecuritiesPhilippinesInc.isaTradingParticipantofthePhilippineStockExchangeandamemberoftheSecuritiesClearingCorporationofthePhilippinesandtheSecuritiesInvestorProtectionFund.ItisregulatedbytheSecuritiesandExchangeCommission.Brazil:BancoJ.P.MorganS.A.isregulatedbytheComissaodeValoresMobiliarios(CVM)andbytheCentralBankofBrazil.Mexico:J.P.MorganCasadeBolsa,S.A.deC.V.,J.P.MorganGrupoFinancieroisamemberoftheMexicanStockExchangeandauthorizedtoactasabrokerdealerbytheNationalBankingandSecuritiesExchangeCommission.Singapore:ThismaterialisissuedanddistributedinSingaporebyorthroughJ.P.MorganSecuritiesSingaporePrivateLimited(JPMSS)[MCI(P)202/03/2017andCo.Reg.No.:199405335R],whichisamemberoftheSingaporeExchangeSecuritiesTradingLimitedand/orJPMorganChaseBank,N.A.,Singaporebranch(JPMCBSingapore)[MCI(P)059/09/2017],bothofwhichareregulatedbytheMonetaryAuthorityofSingapore.ThismaterialisissuedanddistributedinSingaporeonlytoaccreditedinvestors,expertinvestorsandinstitutionalinvestors,asdefinedinSection4AoftheSecuritiesandFuturesAct,Cap.289(SFA).Thismaterialisnotintendedtobeissuedordistributedtoanyretailinvestorsoranyotherinvestorsthatdonotfallintotheclassesof“accreditedinvestors,”“expertinvestors”or“institutionalinvestors,”asdefinedunderSection4AoftheSFA.RecipientsofthisdocumentaretocontactJPMSSorJPMCBSingaporeinrespectofanymattersarisingfrom,orinconnectionwith,thedocument.Japan:JPMorganSecuritiesJapanCo.,Ltd.andJPMorganChaseBank,N.A.,TokyoBranchareregulatedbytheFinancialServicesAgencyinJapan.Malaysia:ThismaterialisissuedanddistributedinMalaysiabyJPMorganSecurities(Malaysia)SdnBhd(18146-X)whichisaParticipatingOrganizationofBursaMalaysiaBerhadandaholderofCapitalMarketsServicesLicenseissuedbytheSecuritiesCommissioninMalaysia.Pakistan:J.P.MorganPakistanBroking(Pvt.)LtdisamemberoftheKarachiStockExchangeandregulatedbytheSecuritiesandExchangeCommissionofPakistan.SaudiArabia:J.P.MorganSaudiArabiaLtd.isauthorizedbytheCapitalMarketAuthorityoftheKingdomofSaudiArabia(CMA)tocarryoutdealingasanagent,arranging,advisingandcustody,withrespecttosecuritiesbusinessunderlicencenumber35-07079anditsregisteredaddressisat8thFloor,Al-FaisaliyahTower,KingFahadRoad,P.O.Box51907,Riyadh11553,KingdomofSaudiArabia.Dubai:JPMorganChaseBank,N.A.,DubaiBranchisregulatedbytheDubaiFinancialServicesAuthority(DFSA)anditsregisteredaddressisDubaiInternationalFinancialCentre-Building3,Level7,POBox506551,Dubai,UAE.CountryandRegionSpecificDisclosuresU.K.andEuropeanEconomicArea(EEA):Unlessspecifiedtothecontrary,issuedandapprovedfordistributionintheU.K.andtheEEAbyJPMSplc.InvestmentresearchissuedbyJPMSplchasbeenpreparedinaccordancewithJPMSplc"spoliciesformanagingconflictsofinterestarisingasaresultofpublicationanddistributionofinvestmentresearch.ManyEuropeanregulatorsrequireafirmtoestablish,implementandmaintainsuchapolicy.FurtherinformationaboutJ.P.Morgan"sconflictofinterestpolicyandadescriptionoftheeffectiveinternalorganisationsandadministrativearrangementssetupforthepreventionandavoidanceofconflictsofinterestissetoutatthefollowinglinkhttps://www.jpmorgan.com/jpmpdf/1320742677360.pdf.ThisreporthasbeenissuedintheU.K.onlytopersonsofakinddescribedinArticle19(5),38,47and49oftheFinancialServicesandMarketsAct2000(FinancialPromotion)Order2005(allsuchpersonsbeingreferredtoas"relevantpersons").Thisdocumentmustnotbeactedonorreliedonbypersonswhoarenotrelevantpersons.Anyinvestmentorinvestmentactivitytowhichthisdocumentrelatesisonlyavailabletorelevantpersonsandwillbeengagedinonlywithrelevantpersons.InotherEEAcountries,thereporthasbeenissuedtopersonsregardedasprofessionalinvestors(orequivalent)intheirhomejurisdiction.Australia:ThismaterialisissuedanddistributedbyJPMSALinAustraliato"wholesaleclients"only.Thismaterialdoesnottakeintoaccountthespecificinvestmentobjectives,financialsituationorparticularneedsoftherecipient.TherecipientofthismaterialmustnotdistributeittoanythirdpartyoroutsideAustraliawithoutthepriorwrittenconsentofJPMSAL.Forthepurposesofthisparagraphtheterm"wholesaleclient"hasthemeaninggiveninsection761GoftheCorporationsAct2001.Germany:ThismaterialisdistributedinGermanybyJ.P.MorganSecuritiesplc,FrankfurtBranchwhichisregulatedbytheBundesanstaltfürFinanzdienstleistungsaufsicht.HongKong:The1%ownershipdisclosureasofthepreviousmonthendsatisfiestherequirementsunderParagraph16.5(a)oftheHongKongCodeofConductforPersonsLicensedbyorRegisteredwiththeSecuritiesandFuturesCommission.(Forresearchpublishedwithinthefirsttendaysofthemonth,thedisclosuremaybebasedonthemonthenddatafromtwomonthsprior.)J.P.MorganBroking(HongKong)Limitedistheliquidityprovider/marketmakerforderivativewarrants,callablebullbearcontractsandstockoptionslistedontheStockExchangeofHongKongLimited.AnupdatedlistcanbefoundonHKExwebsite:http://www.hkex.com.hk.Korea:ThisreportmayhavebeeneditedorcontributedtofromtimetotimebyaffiliatesofJ.P.MorganSecurities(FarEast)Limited,SeoulBranch.Singapore:Asatthedateofthisreport,JPMSSisadesignatedmarketmakerforcertainstructuredwarrantslistedontheSingaporeExchangewheretheunderlyingsecuritiesmaybethesecuritiesdiscussedinthisreport.Arisingfromitsroleasdesignatedmarketmakerforsuchstructuredwarrants,JPMSSmayconducthedgingactivitiesinrespectofsuchunderlyingsecuritiesandholdorhaveaninterestinsuchunderlyingsecuritiesasaresult.TheupdatedlistofstructuredwarrantsforwhichJPMSSactsasdesignatedmarketmakermaybefoundonthewebsiteoftheSingaporeExchangeLimited:http://www.sgx.com.Inaddition,JPMSSand/oritsaffiliatesmayalsohaveaninterestorholdinginanyofthesecuritiesdiscussedinthisreport–pleaseseetheImportantDisclosuressectionabove.Forsecuritieswheretheholdingis1%orgreater,theholdingmaybefoundintheImportantDisclosuressectionabove.Forallothersecuritiesmentionedinthisreport,JPMSSand/oritsaffiliatesmayhaveaholdingoflessthan1%insuchsecuritiesandmaytradetheminwaysdifferentfromthosediscussedinthisreport.EmployeesofJPMSSand/oritsaffiliatesnotinvolvedinthepreparationofthisreportmayhaveinvestmentsinthesecurities(orderivativesofsuchsecurities)mentionedinthisreportandmaytradetheminwaysdifferentfromthosediscussedinthisreport.Taiwan:ThismaterialisissuedanddistributedinTaiwanbyJ.P.MorganSecurities(Taiwan)Limited.AccordingtoParagraph2,Article7-1ofOperationalRegulationsGoverningSecuritiesFirmsRecommendingTradesinSecuritiestoCustomers(asamendedorsupplemented)and/orotherapplicablelawsorregulations,pleasenotethattherecipientofthismaterialisnotpermittedtoengageinanyactivitiesinconnectionwiththematerialwhichmaygiverisetoconflictsofinterests,unlessotherwisedisclosedinthe“ImportantDisclosures”inthismaterial.India:Forprivatecirculationonly,notforsale.Pakistan:Forprivatecirculationonly,notforsale.NewZealand:ThismaterialisissuedanddistributedbyJPMSALinNewZealandonlytopersonswhoseprincipalbusinessistheinvestmentofmoneyorwho,inthecourseofandforthepurposesoftheirbusiness,habituallyinvestmoney.JPMSALdoesnotissueordistributethismaterialtomembersof"thepublic"asdeterminedinaccordancewithsection3oftheSecuritiesAct1978.TherecipientofthismaterialmustnotdistributeittoanythirdpartyoroutsideNewZealandwithoutthepriorwrittenconsentofJPMSAL.Canada:Theinformationcontainedhereinisnot,andundernocircumstancesistobeconstruedas,aprospectus,anadvertisement,apublicoffering,anoffertosellsecuritiesdescribedherein,orsolicitationofanoffertobuysecuritiesdescribedherein,inCanadaoranyprovinceorterritorythereof.AnyofferorsaleofthesecuritiesdescribedhereininCanadawillbemadeonlyunderanexemptionfromtherequirementstofileaprospectuswiththerelevantCanadiansecuritiesregulatorsandonlybyadealerproperlyregisteredunderapplicablesecuritieslawsor,alternatively,pursuanttoanexemptionfromthedealerregistrationrequirementintherelevantprovinceorterritoryofCanadainwhichsuchofferorsaleismade.TheinformationcontainedhereinisundernocircumstancestobeconstruedasinvestmentadviceinanyprovinceorterritoryofCanadaandisnottailoredtotheneedsoftherecipient.Totheextentthattheinformationcontainedhereinreferencessecuritiesofanissuerincorporated,formedorcreatedunderthelawsofCanadaoraprovinceorterritoryofCanada,anytradesinsuchsecuritiesmustbeconductedthroughadealerregisteredinCanada.Nosecuritiescommissionorsimilarregulatoryauthorityin29
JJParkAsiaPacificEquityResearch(82-2)758-571720February2018jj.park@jpmorgan.comCanadahasreviewedorinanywaypassedjudgmentuponthesematerials,theinformationcontainedhereinorthemeritsofthesecuritiesdescribedherein,andanyrepresentationtothecontraryisanoffence.Dubai:ThisreporthasbeenissuedtopersonsregardedasprofessionalclientsasdefinedundertheDFSArules.Brazil:OmbudsmanJ.P.Morgan:0800-7700847/ouvidoria.jp.morgan@jpmorgan.com.General:Additionalinformationisavailableuponrequest.InformationhasbeenobtainedfromsourcesbelievedtobereliablebutJPMorganChase&Co.oritsaffiliatesand/orsubsidiaries(collectivelyJ.P.Morgan)donotwarrantitscompletenessoraccuracyexceptwithrespecttoanydisclosuresrelativetoJPMSand/oritsaffiliatesandtheanalyst"sinvolvementwiththeissuerthatisthesubjectoftheresearch.Allpricingisindicativeasofthecloseofmarketforthesecuritiesdiscussed,unlessotherwisestated.Opinionsandestimatesconstituteourjudgmentasofthedateofthismaterialandaresubjecttochangewithoutnotice.Pastperformanceisnotindicativeoffutureresults.Thismaterialisnotintendedasanofferorsolicitationforthepurchaseorsaleofanyfinancialinstrument.Theopinionsandrecommendationshereindonottakeintoaccountindividualclientcircumstances,objectives,orneedsandarenotintendedasrecommendationsofparticularsecurities,financialinstrumentsorstrategiestoparticularclients.Therecipientofthisreportmustmakeitsownindependentdecisionsregardinganysecuritiesorfinancialinstrumentsmentionedherein.JPMSdistributesintheU.S.researchpublishedbynon-U.S.affiliatesandacceptsresponsibilityforitscontents.Periodicupdatesmaybeprovidedoncompanies/industriesbasedoncompanyspecificdevelopmentsorannouncements,marketconditionsoranyotherpubliclyavailableinformation.ClientsshouldcontactanalystsandexecutetransactionsthroughaJ.P.Morgansubsidiaryoraffiliateintheirhomejurisdictionunlessgoverninglawpermitsotherwise."OtherDisclosures"lastrevisedJanuary01,2018.Copyright2018JPMorganChase&Co.Allrightsreserved.Thisreportoranyportionhereofmaynotbereprinted,soldorredistributedwithoutthewrittenconsentofJ.P.Morgan.#$J&098$#*P30'
您可能关注的文档
- 全国二极管行业知名企业大全-二极管供应商及品牌介绍2018.07
- 稳压二极管行业现状及发展趋势分析.doc
- 2012-2016年中国阶跃恢复二极管行业发展现状调研及投资风险评估报.doc
- 中国晶体二极管行业分析及发展前景研究报告(2018年版)
- 发光二极管行业运营态势及发展方向咨询报告精选
- 中国二极管行业发展研究报告
- 中国检波二极管行业研究分析及投资前
- 发光二极管行业专题:视觉至上时代,发光二极管“超高清”盛宴
- 中国nas网络存储器行业市场调研预测与标杆企业分析报告(2016版)
- 汇丰银行-存储器行业-memory sector:broader server impact on dram asp and earnings-20170628-hsbc
- 存储器行业数据分析报告(201104)
- 中国nas网络存储器行业现状调研分析及发展趋势研究报告(2016版)
- 中国nas网络存储器行业市场调研预测与标杆企业分析报告(2016版)
- nas网络存储器行业现状与前景分析.doc