

- 2.59 MB
- 2022-04-29 13:58:16 发布
- 1、本文档共5页,可阅读全部内容。
- 2、本文档内容版权归属内容提供方,所产生的收益全部归内容提供方所有。如果您对本文有版权争议,可选择认领,认领后既往收益都归您。
- 3、本文档由用户上传,本站不保证质量和数量令人满意,可能有诸多瑕疵,付费之前,请仔细先通过免费阅读内容等途径辨别内容交易风险。如存在严重挂羊头卖狗肉之情形,可联系本站下载客服投诉处理。
- 文档侵权举报电话:19940600175。
'中国可再生能源目录PMSummary4INDUSTRYANALYSIS7Costreductionsaccelerating8Operatingenvironmentimproving16Valuation:Attractiverisk/rewardprofiledespiteshort-termpolicyuncertainties21Risks26COMPANYANALYSIS27LongiGreen(601012.SS):Drivingglobalmonopenetration;initiateatBuy28ZhejiangChint(601877.SS):Drivingfull-cyclesolarsolution;initiateatBuy40Tongwei(600438.SS):Emergingpolygiant;initiateatBuy52Goldwind(2208.HK/002202.SZ):Leadingturbinemaker;initiateH-shareatBuy62HuanengRenewable(0958.HK):ContinuedimprovementinutilizationtodriveEBITmargin;initiateatBuy72XinyiSolar(0968.HK):LeadingPVglassmaker,butvaluationpremiumunjustified;initiateatSell78LongyuanPower(0916.HK):Offshoreprojectstosupportinstallations;initiateatNeutralonlimitedupside86SungrowPower(300274.SZ):Growingglobalsharesbutvaluationfair;initiateatNeutral92APPENDICES101Appendix1:Stabilityofsupplyfromupstreamkeycomponent102Appendix2:Sectorbackground:highgrowthfueledbyhighsubsidy103Appendix3:M&AFramework106信息披露附录108
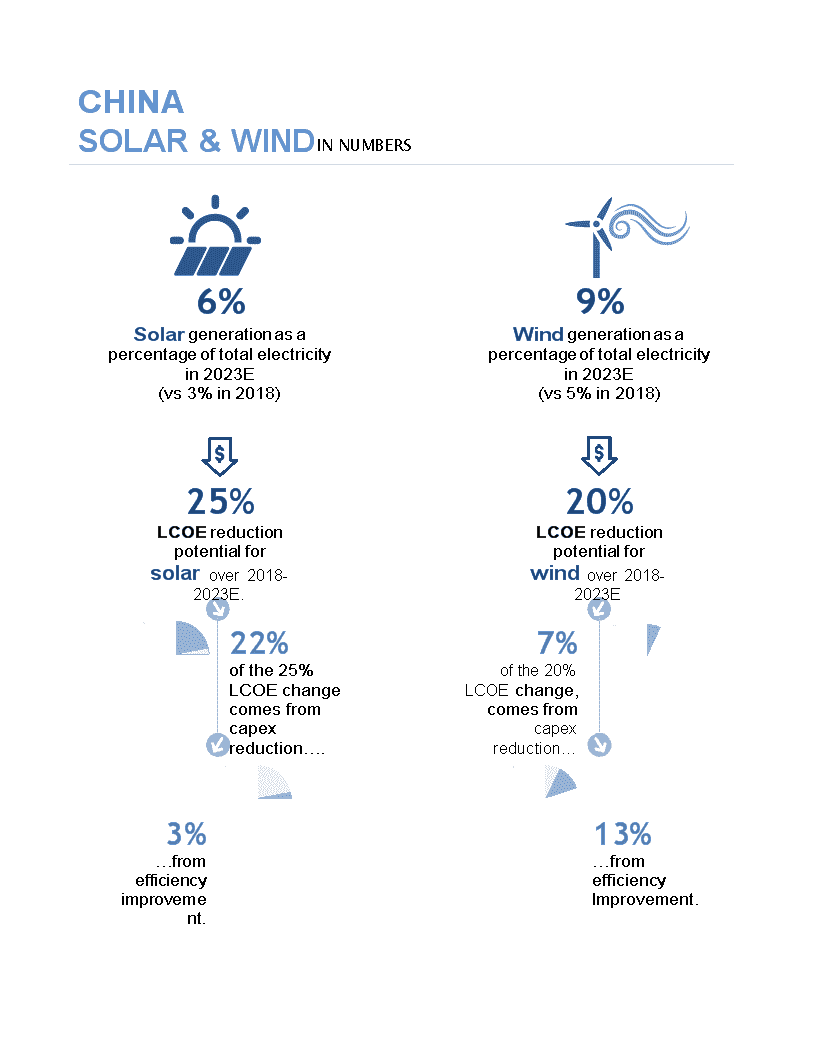
CHINASOLAR&WINDINNUMBERS6%Solargenerationasapercentageoftotalelectricityin2023E(vs3%in2018)9%Windgenerationasapercentageoftotalelectricityin2023E(vs5%in2018)25%LCOEreductionpotentialforsolarover2018-2023E.22%ofthe25%LCOEchangecomesfromcapexreduction….20%LCOEreductionpotentialforwindover2018-2023E7%ofthe20%LCOEchange,comesfromcapexreduction…3%…fromefficiencyimprovement.13%…fromefficiencyImprovement.
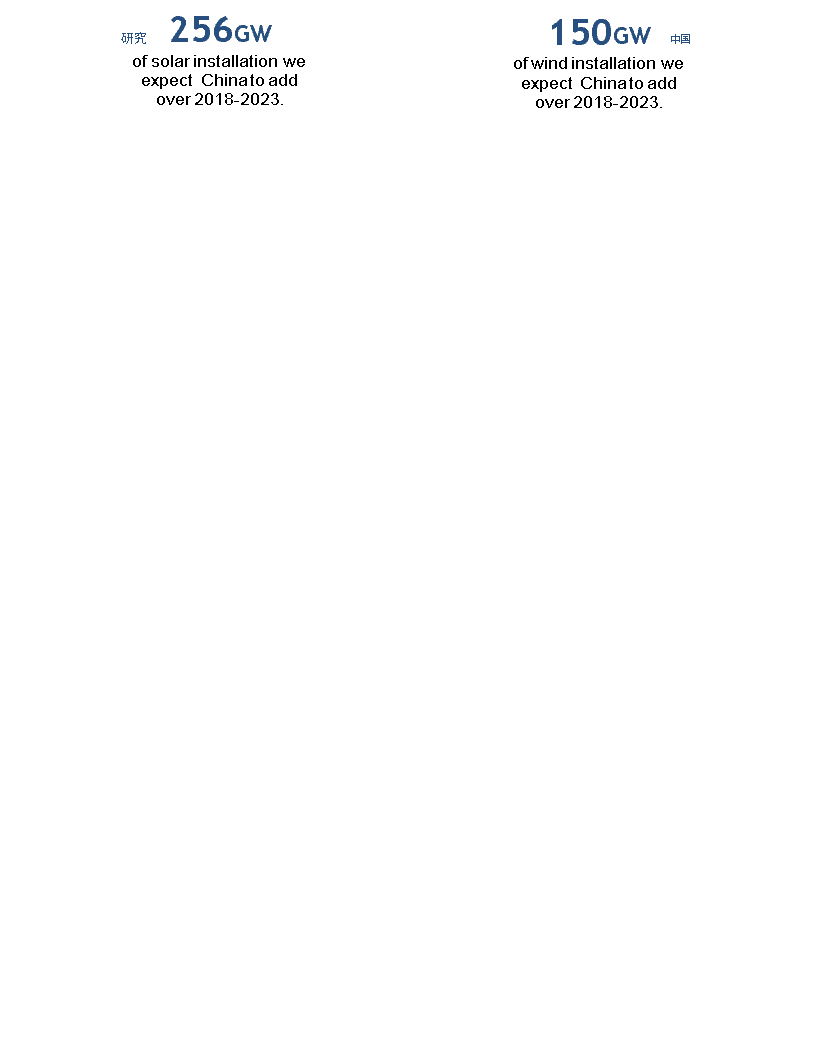
研究中国256GWofsolarinstallationweexpectChinatoaddover2018-2023.150GWofwindinstallationweexpectChinatoaddover2018-2023.
研究中国PMSummaryAcceleratingcost-reductionandimprovingoperatingenvironmenttodriveinstallationoutlook;BuycostleadersinupstreamandefficiencyleadersindownstreamWeforecast25%/20%costreductionsforsolar/windpowerin2018-23E.Webelievede-subsidizationpoliciespublishedinMay2018haveacceleratedcostreductionsforsolarandwindpowerinChina.WeforecastaverageLCOE(levelizedcostofelectricity)ofutility-scalesolarandon-shorewindpowerofUS$0.063/kwhandUS$0.060/kwhin2018,andweexpecttechnologicaladvancementstodrivefurthercostsreductionsof25%/20%in2018-23E.Improvingoperatingenvironment.Weexpecttheoperatingenvironmentofthesolarandwindsectorstograduallyimproveas:1)powerdemandinChinaremainsresilientin2019andbeyonddespiteapotentialeconomicslowdown;2)thereinforcementofRPS(RenewableEnergyPortfolioSystem)andthepotentialopeningupofsubsidy-freeprojectspromoterenewableenergyinvestment(solarandwindinparticular)overthelongterm.Competitionstillfiercedespiteasolidinstallationoutlook;leadersstandoutamidsectorconsolidation.Weforecastrapidlydeclininggenerationcostsandanimprovingoperatingenvironmenttodrive256GW/150GWsolar/windinstallationsin2018-23EwithaggregatecapexinvestmentofRmb1,040bnandRmb1,083bn,respectively.Weexpectupstreamcompetitiontoremainfierce,especiallyinthesolarsector,andupstreamconsolidationtocontinue.WeexpectupstreamleaderswithR&Dandexecutionstrengthtostandout,anddownstreamleaderswithoutstandingoperatingefficiencyandstrongbalancesheetstobenefitfromcostreductionsintheupstreamvaluechain.OurtopBuypicksareLongi,ZhejiangChintandHNR.WebelieveChina’ssolarandwindsectorsofferattractiveriskandreturnprofileswithvaluationsbelowtheaverageofthepastthreeyearandasolidgrowthoutlook.ExceptforLongiandZhejiangChint,ourestimatesare0%-6%belowconsensusfor2018,broadlyinlinefor2019,and2%-20%abovefor2020(exceptforLongyuan).WeinitiateatBuyonLongi,ZhejiangChint,Tongwei,HNRandGoldwind-H;weinitiateatNeutralonSungrow,LongyuanandGoldwind-A.WeinitiateatSellonXinyiSolaraswebelieveitsvaluationpremiumovercomparablepeersisunjustified(mostofourcoveragetradesbelowtheaveragesforcomparablepeers)Our12-monthtargetpriceforXinyiimplies8%downsidevs.the27%averageupsideforoursolarcoverageandthe27%averageupsideforourcombinedsolarandwindcoverage.AsshowninExhibit1,werankoursolarandwindcoverageusingaframeworkthatassessestheirvolumegrowthoutlook,company-specificcatalysts,
upside/downsidetoourtargetprice,netgearing,andcyclicalexposure.Allcategoriesareequallyweighted,withamaximumscoreof5andaminimumscoreof-5.
研究中国LongiandZhejiangChintrankhighestinsolar;HNRandGoldwind-Hrankhighestinwind.图表1:InvestmentframeworkCompanyVolumegrowth2018-20ESolarCompany-specificcatalystsUpside/downsideLongi76%wafershipmentgrowth+Marketsharegain;costreduction+45%upsidetoourRmb26.3/sh,12-monthpricetarget+Chint45%generationgrowthand117%EPCvolumegrowth+Marketsharegain;operatingefficiencyimprovement+38%upsidetoourRmb32.3/sh,12-monthpricetarget+Tongwei300%polyshipmentgrowth+Marketsharegain;costreduction+42%upsidetoourRmb12.3/sh,12-monthpricetarget+Sungrow63%invertershipmentgrowth+Marketsharegain;costreduction+19%upsidetoourRmb11.0/sh,12-monthpricetarget+/-Xinyi46%PVglassshipmentgrowth+Marketsharegain+8%downsidetoourHKD2.6/sh,12-monthpricetarget-WindHNR16%generationgrowth+/-Operatingefficiencyimprovement;cashflowimprovement+42%upsidetoourHKD3.0/sh,12-monthpricetarget+Goldwind-H32%turbineshipmentgrowth+Marketsharegain;costreduction+37%upsidetoourHKD10.4/sh,12-monthpricetarget+Longyuan9%generationgrowth+/-Operatingefficiencyimprovement;cashflowimprovement+13%upsidetoourHKD6.1/sh,12-monthpricetarget+/-Goldwind-A32%turbineshipmentgrowth+Marketsharegain;costreduction+18%upsidetoourRmb12.7/sh,12-monthpricetarget+/-CompanyNetdebt/equity2018ESolarCyclicalexposureScoreLongi-10%+Manufacturer,developer+/-4Chint15%+Assetownership,developer,manufacturer+/-4Tongwei29%+/-Assetownership,manufacturer+/-3Sungrow-27%+Manufacturer,developer+/-3Xinyi59%-Manufacturer,developer+/-0WindHNR152%-Assetownership+2Goldwind-H73%-Assetownership,developer,manufacturer+/-2Longyuan110%-Assetownership+1Goldwind-A73%-Assetownership,developer,manufacturer+/-1Note:“+”=+1,“-”=-1,“+/-”=0,allcategoriesequalweight,with5/-5max/minscores.资料来源:Companydata,GaoHuaSecuritiesResearch图表2:SummaryofourvaluationmethodologyUpside/ValuationTargetCompanyRatingPricetargetdownsidemethodologymultipleBenchmarkRationale(%)(x)SolarLongiBuy26.3Rmb/sh45%EV/EBITDA16.5HistoricalaverageLongi’scurrentEV/EBITDAwasslightlyhigherthantheaverageofpast5-yearrange,butofpeergrouplowerthanhistoricalaverageofcomparablepeergroup.Withasector-leadinggrowthoutlook,weexpectthecompanytotradeuptoaverageofcomparablepeersgroup.ChintBuy32.3Rmb/sh38%EV/EBITDA10.5HistoricalaverageChint’scurrentEV/EBITDAwasbelowaverageofitspast5-yearrange,andalsolowerofpeergroupthanhistoricalaverageofcomparablepeergroup.Withasector-leadinggrowthoutlook,weexpectthecompanytotradeuptoaverageofcomparablepeersgroup.TongweiBuy12.3Rmb/sh42%EV/EBITDA10.2HistoricalaverageTongwei’scurrentEV/EBITDAislowerthanaverageofitspast5-yearrange,andalsoofpeergrouplowerthanhistoricalaverageofcomparablepeergroup.Withasector-leadinggrowthoutlook,weexpectthecompanytotradeuptoaverageofcomparablepeersgroup.SungrowNeutral11.0Rmb/sh19%EV/EBITDA8.5HistoricalaverageSungrow’scurrentEV/EBITDAislowerthanaverageofpast5-yrrangeandcomparableofpeergrouppeer’spast5-yraverage.Withasector-leadinggrowthoutlook,weexpectthecompanytotradeuptoaverageofcomparablepeersgroup.XinyiSell2.6HKD/sh-8%EV/EBITDA7.4HistoricalaverageXinyi’scurrentEV/EBITDAislowerthanhistoricalaverage,buthigherthancomparableWindofpeergrouppeershistoricalaverage.AlthoughwebelieveXinyioperateswithmorediversifiedbusinessandbetterprofitabilities□andgrowthoutlookagainstitspeers.Webelieveitsvaluationpremium□isunjustifiedasmostofourpreferredpicksaretrading□atbelowaveragemultipleofpeersgroup.HNRBuy3.0HKD/sh42%EV/EBITDA6.5-0.5stdofhistoricalHNR’scurrentEV/EBITDAwaslowerthanaverageofpast3-yrrangeandcomparableaveragepeershistoricalaverage.Sincethebeginningof2018,HNRhasbeentradingbetweenpast3-yraverageand1stdbelowaverage.Itappearsthereisade-ratingin2018comparedtotheaverageof2016/17,duetoinvestors’concernonsubsidypaymentandutilization.Wehavediscountedourmorepositiveviewinourestimates,andadopt0.5stdbelowhistoricalaverage(medianofYTDrange)astargetmultiple.Goldwind-HBuy10.4HKD/sh37%EV/EBITDA10.0HistoricalaverageGoldwind-H’scurrentEV/EBITDAislowerthantheaverageofpast5-yrrange,alsolowerofpeergroupthanhistoricalaverageofpeergroup.Withagrowthoutlookhigherthansectoraverage,weexpectthecompanytotradeuptohistoricalaverageofpeergroup.LongyuanNeutral6.1HKD/sh13%EV/EBITDA5.7-1stdofhistroicalLongyuan’scurrentEV/EBITDAwaslowerthanaverageofpast3-yrrangeandaveragecomparablepeershistoricalaverage.Sincethebeginningof2018,Longyuanhasbeentradingbetweenpast3-yraverageand1stdbelowaverage.Itappearsthereisade-ratingin2018comparedtotheaverageof2016/17,duetoinvestors’concernonsubsidypaymentandutilization.Wehavediscountedourmorepositiveviewinourestimates,andadopt1stdbelowhistoricalaverage(0.5stdbelowHNR’stargetmultipleonlowerEBITDAgrowthoutlook)astargetmultiple.Goldwind-ANeutral12.7Rmb/sh18%EV/EBITDA12.3-1stdofhistoricalGoldwind-A’scurrentEV/EBITDAislowerthanaverageofpast5-yrrange.Goldwind’sA-averagesharehas47%averagepremiumoverH-sharesincethebeginningof2013.Webelievethisisduetodifferentperceptionofwindinstallationoutlookfromon-shoreandoff-shoreinvestors.Weapply1stdbelowhistoricalaverageastargetmutiple.资料来源:GaoHuaSecuritiesResearchWeadoptEV/EBITDAastheprimaryvaluationmethodologyforoursolarandwindcoverage.Weselectthecomparablepeergroupasavaluationreferencebasedonthenatureofeachcompany’sbusiness.Weapplytheaveragehistoricalmultipleofthepeergrouptoourcoverage(exceptforLongyuan,HNRandGoldwind-A).ForLongyuan
研究中国andHNR,weapply-1std/0.5stdbelowthehistoricalaveragetoreflectthede-ratingofthetwocompaniessincethebeginningof2018oninvestorconcernsaroundsubsidiesandutilization;wehavereflectedourmorepositiveviewinourestimatesaswebelievetheseissuescouldgraduallyimproveasRPSisreinforced.Weapply1stdbelowthehistoricalaveragetoGoldwind-Aasithasbeentradingatanaverage47%premiumoverGoldwind-H,whichweattributetodifferingperceptionsonthewindinstallationoutlookamongon-shoreandoffshoreinvestors.图表3:Derivationsummaryforour12-monthtargetpricesLongiChintTongweiSungrowXinyi601012.SS601877.SS600438.SS300274.SZ0968.HK2018EV/EBITDA15.410.111.19.29.72019EV/EBITDA11.78.07.57.18.4Historicalaverage14.110.69.419.112.7Histroricalmean12.69.78.718.610.0Peer’saverage16.710.410.28.67.4Peer’s18-20EBITDAcagr22%17%13%8%11%Company18-20EEBITDAcagr31%25%35%26%18%2019EEBITDA4,3876,7815,0921,5683,6172019ENetdebt(1,100)2,6764,091(2,614)6,718TargetmultipleBenchmark16.510.510.2Historicalaverageof8.5peergroup7.4Targetprice26.332.312.311.02.6CurrentPrice18.223.58.79.22.9PricecurrencyCNYCNYCNYCNYHKDUpside45%38%42%19%-8%RatingBUYBUYBUYNeutralSellImplied2019P/E23.014.815.715.38.6Implied2020P/E16.611.312.011.77.4Historicalmedianlevel(2013-18)23.316.523.4188.9LongyuanHNRGoldwind-HGoldwind-A0916.HK0958.HK2208.HK002202.SZ2018EV/EBITDA6.26.210.614.32019EV/EBITDA5.65.98.511.4Historicalaverage7.37.410.715.0Histroricalmean7.47.410.714.6Peer’saverage8.08.010.210.2Peer’s18-20EBITDAcagr5%5%15%15%Company18-20EEBITDAcagr6%6%29%29%2019EEBITDA17,97410,8135,3405,3402019ENetdebt58,94142,31920,52420,524Targetmultiple5.76.510.012.31stdbelowhistorical0.5stdbelowhistoricalHistoricalaverageof1stbelowBenchmarkaverageaveragepeergrouphistoricalaverageTargetprice6.13.010.412.7CurrentPrice5.42.17.610.8PricecurrencyHKDHKDHKDCNYUpside13%42%37%18%RatingNeutralBUYBUYNeutralImplied2019P/E9.48.18.810.8Implied2020P/E8.47.17.18.7Historicalmedianlevel(2013-18)13.18.49.312.9资料来源:GaoHuaSecuritiesResearch,Wind,Bloomberg
研究中国INDUSTRYANALYSIS
CostreductionsacceleratingWebelievefavorablesubsidypolicieshavedrivenmassiveinvestmentandrapidtechnologicaladvancementacrossChina’ssolarandwindsectors,whichhasledtosubstantialcostreductionsoverthelastfiveyears.WeestimateLCOElevelsforsolar/windpowerinChinafell55%/19%in2012-17.Asgenerationcostsdeclinerapidlyandtheoperatingenvironmentimproves,weexpectChina’swindandsolarsectorswillgraduallymovefromasubsidy-driventocost-drivenmodel.图表4:ChinasolaraverageFiTandLCOE图表5:ChinawindaverageFiTandLCOE1.21.11.00.90.80.70.60.50.40.30.2(Rmb/kwh)(Rmb/w)10.09.08.07.06.05.04.03.02.01.00.00.70.60.60.50.50.40.40.39.0(Rmb/kwh)(Rmb/w)8.07.06.05.04.03.02.01.00.0201320142015201620172018E2023ECAPEX(RHS)Coal-fired-FiTSolar-FiTSolar-LCOE201320142015201620172018E2023ECAPEX(RHS)Coal-fired-FiTWind-FiTWind-LCOE研究中国资料来源:NEA,CEC,GaoHuaSecuritiesResearchEstimate资料来源:NEA,CEC,GaoHuaSecuritiesResearchEstimate2018policeshaveacceleratedcostreductions...Webelievethede-subsidizationpoliciespublishedinMay2018haveacceleratedthisprocess.nOnMay18,theNEApublishedanoticestatingthatalltheprovinceswhichhavenotpublished2018windinstallationplansshouldadoptacompetitivebiddingprocesswhenallocatingwindprojectquotaandsettingFiTs(Feed-in-Tariff),andallon-shoreandoffshorewindprojectsshouldbeallocatedquotasandFiTbasedonacompetitivebiddingprocessstartingfrom2019.nOnMay31,theNEA,theNDRCandtheMoFjointlypublishedanoticeregardingsolarpower,statingthatinordertooptimizesolarinstallation:1)noquotaswouldbeallocatedforutility-scalesolarprojectsthatneedsubsidiesinanyformduring2018(2017installation:33GW)andquotaforDG(distributedgeneration)solarprojectswithsubsidieswouldbelimitedto10GW(2017DGinstallation:19GW);2)feed-in-tariffofutility-scalesolarfarmswouldbereducedbyRmb0.05/kwhtoRmb0.5/0.6/0.7/kwhinZoneI/II/IIIandsubsidiesforDGprojectsreducedbyRmb0.05/kwhtoRmb0.32/kwh.Followingthesepolicychanges(fromMay31toOctober21),sharepricesformajorsolar/windnamesfell31%/39%(marketcapweightedaverage)vs.a17%declinefortheCSI300.
图表6:SharepricemovementsforkeysolarandwindcompaniesinChina1.01.00.90.90.80.80.70.70.61.1SolarWindCSI300Note:Solarnames:LongiGreen,SungrowPower,TongweiCo.,XingyiSolar,ZhejiangChint;Windnames:LongyuanPower,HuanengRenewable,Goldwind资料来源:WindKeysolarproductshaveseenasignificantASPdeclineduringJunetoOctober(vs.January-May),astheabruptpolicychangescausedasharpdeclineininstallationsduring3Q18.Chinapolysilicon/wafer/cellASPsfellasmuchas23%/37%/32%inJune-Octobervs.declinesof8%/25%/25%inJanuary-May.ModuleASPssawaslightrecoveryinlateAugustdrivenbythestart-upoffront-runnerprograms.图表7:ASPmovementofkeysolarproductsinChina图表8:Averagebiddingpricefor2.0MWwindturbineMonomoduleMultimoduleMonocellMulticellMonowaferMultiwaferPolysilicon3,800(Rmb/kw)3,7003,6003,5003,4003,3003,2003,1003,0002,900-40%-35%-30%-25%-20%-15%-10%-5%0%Jun-Oct2018Jan-May2018Averagebiddingpricefor2.0MWturbine研究中国资料来源:PVinsight资料来源:Goldwind
WeestimateaverageLCOEofutility-scalesolarandon-shorewindpowerwasUS$0.063/kwhandUS$0.060/kwhin2018,andweexpecttechnologicaladvancementcoulddrivefurthercostreductionsof25%and200%in2018-23E.Weexpectsolar
研究中国LCOEreductiontomainlybedrivenbyupstreamcapexreductionandLCOEreductiontobedrivenbyanimprovementinsystemefficiencies.图表9:Weestimate25%and20%LCOEreductionpotentialforsolarandwindin2018-23ELCOEcalculationformajorpowerprojectsinChina2018ELCOEGasSolar-DGOff-shorewindSolar-utilityOn-shoreWindCoalNuclearHydroCapex/kW(Rmb)Capex/kW(USD)5,0007355,20076512,0001,7654,5006627,2501,0663,80055915,0002,2068,0001,176Lifetime(Yrs)2020202020303030Utilizationhours3,6001,1002,8001,2502,0004,2007,0003,500Equityfinancing%25%25%25%25%25%25%25%25%Debtfinancing%75%75%75%75%75%75%75%75%Equityrequiredreturn8%8%8%8%8%8%8%8%Debtrequiredreturn6%6%6%6%6%6%6%6%LCOE(Rmb/kwh)0.730.570.500.430.410.360.330.26LCOE(USD/kwh)0.1070.0830.0740.0630.0600.0540.0480.0382023ELCOEGasSolar-DGOff-shorewindSolar-utilityOn-shoreWindCoalNuclearHydroCapex/kW(Rmb)Capex/kW(USD)5,0007354,10060311,2001,6473,5005156,7009853,80055915,0002,2068,0001,176Lifetime(Yrs)2020202020303030Utilizationhours3,6001,1503,2501,3002,3004,2007,0003,500Equityfinancing%25%25%25%25%25%25%25%25%Debtfinancing%75%75%75%75%75%75%75%75%Equityrequiredreturn8%8%8%8%8%8%8%8%Debtrequiredreturn6%6%6%6%6%6%6%6%LCOE(Rmb/kwh)0.730.430.410.320.330.360.330.26LCOE(USD/kwh)0.1070.0630.0600.0470.0480.0540.0480.038(USD/kwh)(USD/kwh)25%reductionpotentialforUtility-scaleSolar20%reductionpotentialforOn-shoreWindGasSolar-DGOff-shorewindSolar-utilityOn-shoreWindCoalNuclearHydro0.120.120.100.100.080.080.060.060.040.040.020.020.00-LCOE-2018ELCOE-2023E资料来源:GaoHuaSecuritiesResearchSolarcostreductionsdrivenbycapexreductionWeforecastLCOEofutility-scalesolartofall25%in2018-23E(22pptfromcapexreductionand3pptfromefficiencyimprovements).Weexpectunitcapexforutility-scalesolarpowertofallfromUS$0.66/win2018EtoUS$0.52/win2023E.
图表10:WeexpectlowercapextobethemaindriverofreductioninsolarLCOEUtility-scalesolarLCOE/CAPEXbreakdownandsensitivityanalysis0.70(USD/w)0.07WeexpectCAPEXtodeclineby22%over2018-23E(USD/w)WeexpectLCOEtodeclineby25%over2018-23E,22%fromCAPEXreduction,3%fromefficiencyimprovement0.060.600.050.500.040.030.020.400.010.300.002018E2023EDepreciationcostFinancialcostOPEX0.200.100.002018E2023ECAPEX(Rmb/kw)Utilizations2,8353,1503,5003,8504,2351,1370.300.330.370.400.451,1970.280.310.350.380.421,2600.270.300.330.370.401,3230.260.280.320.350.381,3890.240.270.300.330.36CAPEX(Rmb/kw)研究中国2,8353,1503,5003,8504,2351,137-10%0%11%22%34%1,197-15%-5%5%16%27%Utilizations1,260-19%-10%0%10%21%1,323-23%-14%-5%5%15%1,389-27%-18%-9%0%10%PolyproductioncostPolygrossprofitWaferprocessingcostWafergrossprofitCellprocessingcostCellgrossprofitModuleprocessingcostModulegrossprofitSolarinverterBOS资料来源:GaoHuaSecuritiesResearchTechnologicaladvancestodrivecostreductionsacrossvaluechainWeexpecttechnologicaladvancestobethemaindriverofcostreductionsacrossthevaluechain.nPoly-silicon:Moreadvancedhydrogenationprocesstoreduceelectricitycosts.AccordingtoBloombergNewEnergyFinance(BNEF),electricitycostsaccountfor48%ofproductioncostsforpolysilicon.AccordingtotheChinaPhotovoltaicIndustryAssociation(CPIA),averageunitpowerconsumptionwas65Kwh/kgin2018,andisexpectedtobefurtherreducedto58kwh/kgin2025Ethroughamoreadvancedhydrogenationprocess.Inaddition,moreleadingplayersarebuildingnewcapacityinregionswithlowerpowertariffssuchasInnerMongolia,Sichuan,etc.
图表11:ElectricityisthelargestcomponentforpolysiliconproductionCostbreakdownofpolysiliconproduction图表12:Unitpowerconsumptioncouldfallfrom65kwh/kgin2018to58kwh/kgin2025Averageunitpowerconsumptioninpolysiliconproductionprocess85.0(Kwh/kg)16%7%48%29%80.075.0ElectricitySiliconmetalLabourGas,steam,O&Mandothers70.065.060.055.050.0201620172018202020222025Unitpowerconsumtion资料来源:BNEF资料来源:CPIAnWafers:Moreadvanceddiamondwire(DW)cuttingtoincreasewaferyield,andrisingmonopenetrationtodriveefficiencies.Weexpectrisingcostperformanceandbettercost-reductionpotentialandupsideforefficiencyimprovementtofurtherdrivemarketsharegainsbymonosolutions.Webelievemonowafers,whichhaveamorefavorablemolecularstructure,aremoreadaptabletomoreadvancedDWcuttingtechnology,whichincreaseswaferyieldandreducesunitpolysiliconconsumption.图表13:Globalmonopenetrationtorisefrom28%in2017to55%in2021EMarketshareofmultiandmonosolution图表14:MonowaferscontinuetoseerisingpoweroutputPoweroutputofmultiandmonowafers120%5.5100%5.080%60%4.540%4.020%3.50%201620172018201920202021MultiMono3.020112012201320142015201620172018MultiwaferpoweroutputMonowaferpoweroutput研究中国资料来源:BNEF资料来源:BNEF
图表15:Costbreakdownofwaferproduction图表16:DWcuttingenablesmonowaferstoreducepolysiliconconsumptionPer-wattpolysiliconconsumptionofmultiandmonowafers4.03.53.02.52.01.51.00.56.0(g/w)5.04.03.02.01.00.0MultiMonoPolysilicon-to-brickBrick-to-wafer(UScent/w)0.0201320142015201620172018MultiMono资料来源:BNEF资料来源:BNEF图表17:BNEFexpectDWcuttingtoenablemonowaferstoreach63picyieldper1kgbrickin2018Averagewaferyieldper1kgbrickandDWconsumptionperpic(pic/1kgbrick)64.02.562.060.058.056.054.052.02.01.51.00.550.0201720180.0Multi-waferyieldMono-waferyieldMulti-DWconsumption(RHS)Mono-DWconsumption(RHS)研究中国资料来源:BNEFnCells/modules:High-efficiencycell/dual-glasssolutionstodriveefficiency.Weexpectefficiencyimprovementtobethekeydriverofcostreductionsforcell/modules.Intheshortterm,PERC(passivatedemitterandrearcell)solutioncouldexpandmarketsharefrom12%in2017to41%in2020accordingtoBNEF.Afterthat,mainstreamsolutioncouldgraduallyshifttotheHIT(heterojunctionwithintrinsicthinlayer)andIBC(interdigitatedbackcontact)solutions.Inaddition,modulemanufacturershaveincreasedtheiradoptionofabi-facialdual-glasssolutiontoreplacethetraditionalaluminumframesandback-sheetsubstratewithPVglass.Thebi-facialcellsarethereforefullyencapsulatedinglassandcangenerateanextra10%-30%powerfromthebackside.AccordingtotheCPIA,thepenetrationofthedual-glasssolutionamongChinamodulemakerscouldrisefrom8%in2017to35%in2025.Webelievethistrendcouldeffectivelyincreasethedemandforsolarglassoverthelongterm.
图表18:High-efficiencycellstogainmarketshareoverthelongtermMarketshareofdifferenttypesofsolarcell图表19:Averageyear-endcellpoweroutputbytechnologies100%90%80%70%60%50%40%30%20%10%0%201620172018201920202021N-typemonoIBCN-typemonoHITN-typemonoPERTP-typemonoPERC/PERLP-typemonoAl-BSFP-typemultiPERCP-typemultiAl-BSF7.06.05.0Efficiency4.03.02.01.00.0(W/pic)MultiAl-BSFMultiPERCMonoAl-BSFMonoPERCN-typePERTHJT20172018资料来源:BNEF资料来源:BNEF图表20:Averagemoduleefficiencyforecast图表21:Dual-glasssolutiontogainmarketshareMarketshareofdifferentback-coversolution19.0%18.5%18.0%17.5%17.0%16.5%16.0%15.5%15.0%14.5%14.0%201320142015201620172018MonomoduleMultimdoule100%90%80%70%60%50%40%30%20%10%0%201620172018202020222025TPTbacksheetnon-TPTbacksheetGlassbacksheet研究中国资料来源:BNEF资料来源:CPIAWindcostreductiondrivenbyefficiencyimprovementsWeexpectLCOEofon-shorewindpowertofallby20%in2018-23E(13pptfromefficiencyimprovementand7pptfromcapexreduction).Weexpectturbinecosttofall3%p.a.andBOS(BalanceofSystem)toincreaseby1%p.a.asinstallationsgraduallymovefromwesternChinatoeasternandsouthernChina.Overall,weexpectunitcapexforon-shorewindpowertofall4%in2018-23.
图表22:WeexpectwindLCOEtofall20%in2018-23EOnshorewindpowerLCOE/CAPEXbreakdownandsensitivityanalysis0.070.061.20(USD/w)WeestimateLCOEtofallby20%over2018-23E,13%fromefficiencyimprovementand7%fromCAPEXreduction(USD/w)Weturbinecosttofall3%p.awhileBOStoincreaseby1%p.a.TotalCAPEXtofall4%over2018-23E1.000.800.600.050.400.040.200.030.002018EWindturbineBOS2023E研究中国CAPEX(Rmb/W)6,0476,3652,3000.300.312,4150.280.30Utilizations2,3000.300.316,7000.330.310.337,0357,3870.350.360.330.350.350.362,4150.280.300.310.330.352,5360.270.280.300.310.33CAPEX(Rmb/W)0.020.016,0476,3656,7007,0357,3872,300-10%-5%0%5%10%2,415-14%-10%-5%0%5%Utilizations2,300-10%-5%0%5%10%2,415-14%-10%-5%0%5%2,536-18%-14%-9%-5%0%02018E2023EDepreciationcostFinancialcostOPEX资料来源:GaoHuaSecuritiesResearchHowever,asdownstreamwindfarmoperatorsincreasetheadoptionoflarger-sizedandmoreefficientturbines,weexpectaverageutilizationhourstoimprovefrom2,000hoursin2018Eto2,300hoursin2023E.
OperatingenvironmentimprovingRenewableportfoliosystemandopeningupofsubsidy-freeprojectstopromoterenewableinvestmentinthelongtermTheNEApublishedtheconsultationdocumentsforarenewableenergyportfoliosysteminMarch,SeptemberandNovemberof2018.Inthelatestversionofitsconsultationdocuments,theNEAhassetaspecificminimumandanincentiverenewableenergyconsumptiontargetforeachprovinceandallowedthepurchaseofgreencertificatesasanalternativesolutiontofulfilltheRPStargets.WebelievethereinforcementofRPScouldimprovethegenerationshareofnon-hydrorenewableenergyconsumptionby3-4pptin2017-20andeffectivelypromoterenewableenergyinvestmentinChinaoverthelongterm.图表23:Renewableenergyportfoliosystemkeyinfo:setaspecificminimumandanincentiverenewableenergyconsumptiontargetforeachprovinceandallowedthepurchaseofgreencertificatesasanalternativesolutiontofulfilltheRPStargetsDraftpublishedinNov13th,2018DraftpublishedinMar23rd,2018GeneraltermSetmininumrequiredandincentivetargetsfortotalrenewableenergySettargetfortotalrenewableenergyandnon-hydroandnon-hydrorenewableenergyconsumptionineachprovinces.Therenewableenergyconsumptionineachprovinceincentivetargetwouldbesetas10%higherthanmininumrequiredtarget.EntitywithrepsonsibilityandobligationsLocalgovernmentineachprovincesshouldundertaketheimplementationresponsibilities,andpowersalescorporatesandendaccordingtorenewableresources,nationalenergyplanandconstructionstatusofcross-regionaltransmissionfacilitiesGridcompaniesineachprovinces,otherpowersalescorporates,industrialcompanieswithin-housepowerpowerusersshouldundertaketheobligationofthesystem,including:plants,andend-usersparticipatedirectpowersales1)allgridcompanies,independentpowersalescorportsandpowersalescorporateswithdistributionrights;2)enduserswhoparticipatedirectpowersalesandcorporatewithin-housepowerplants.ConnectthesystemwithpowersalesPowesalescorporatesareresponsibleforimplementingandprioritizingpowersalesrelatedtorenewableenergyAlternativesolutionsResponsbileentitiescouldseekalternativesolutionstofulfillitsshouldundertaketheobligationofthesystem.Thetargetforcorporateswithcoal-firedin-housepowerplantsshouldbehigherthanthetargetforthelocalprovince.GridcompaniesineachprovincesshouldsetimplementationplanaccordingtoRPStargetandguidethepowersalesparticipantstoprioritizetransactiononrenewableenergyandreinforceallocationofRPStargetsifmarket-basetransactioncannotensurethefulfillmentofRPStargets."Renewableenergycertificate"systemwouldberesponsiblities:1)purchaserenewableenergyfromotherentitieswhoestablishedtorecordtheproduction,consumptionexceededtheirtargests;2)voluntarilypurchaseequvalientamountofandtransactionofrenewableenergy.Eachcertificategreencertificates.MonitoringandevaluationofRPSNationalrenewableenergyinformationmanagementcommitteeareresponsibleforsetupaccountsforundertaking,evaluationandtransferofRPSinfo.BeijingpowersalesexchangeandGuangzhoupowersalesexchangeareresponsibleforimplementingcross-regionalpowersalestransaction.TreatmentofrenewableenergyexceededthetargestsFortheamountofpowerexceededincentivetargests,noextraamountofpowerwouldbeincludedinthecalaculationofRPStargerts.2018/19targetsNoevaluationwouldbemadeonthecompletionof2018Targetsand2019Targetswouldbereleasedin1Q2019.MethodologyforsettingthetargetsEnergysupervisorydepartmentsineachprovincesareresponsibleforsettingsuggestedmininumrequiedRPStargetswithsupportfromStateGridandSouthernGrid,andshouldbesubmittedforStateCouncil’sreview.StateCouncilwouldberesponsibleforpublishingfinalRPStargetsbeforetheendofMarchineveryyears.equals1Mwhofrenewableenergypower,andcertificateswouldbecategorizedintohydropowercertificateandnon-hydrorenewableenergypower.Gridcompaniesareresponsibleforcalculationofrenewableenergycertificates,marketparticipantswhocannotfulfilltheRPStargetshavetopurchaserenewableenergycertificatefromlocalgridcompanies,andtheincomewouldbeusedtosupporttheconsumptionofrenewableenergywithintheregion.Pricingofhydroandnon-hydrorenewableenergycertificatesshouldbebasedonmarket-basedtransaction.LocalgridcompaniesareresponsibleforsettingthepricingplanandsubmittingforStateCouncil’sregistration.EnergysupervisorydepartmentofStateCouncilwillberesponsibleformonitoring,evaluatingthecompletionofRPStargetsandpublishrelatedreviewreportsannually.ForprovincewhichfailedtomeetRPStargets,StateCouncilwouldsuspendorreducetheconstructionscaleoffossil-fueledpowerprojects;FormarketparticipantswhofailedtocompleteRPStargets,itsscaleofmarket-basedpowersaleswouldbereducedorevencanceled.研究中国资料来源:NEA
研究中国图表24:RPStargetsineachprovincevs.2017actualnumbersDraftpublishedinMar2018DraftpublishedinNov2018TargetfortotalrenewableenergyProvince201820202018minrequired2018incentive2020minrequired2020incentive2017Beijing11.0%13.5%11.0%12.1%15.0%16.5%12.1%Tianjing11.0%13.5%11.0%12.1%15.0%16.5%10.4%Heibei11.0%13.5%11.0%12.1%15.0%16.5%11.6%Shanxi14.0%16.0%15.0%16.3%16.5%18.0%14.1%Innermongolia14.0%16.0%18.5%20.3%18.5%20.3%19.2%Liaoning10.5%10.5%12.0%13.0%12.5%13.6%12.2%Jilin20.0%25.5%20.0%21.5%22.0%23.7%22.2%Heilongjiang18.5%24.5%19.5%21.0%26.0%28.1%20.2%Shanghai30.5%31.5%31.5%32.0%33.0%33.5%33.3%Jiangsu13.5%13.5%14.5%15.1%15.0%15.8%14.7%Zhejiang17.0%17.5%18.0%18.5%19.0%19.8%19.3%Anhui15.5%17.5%13.0%14.0%14.5%15.7%14.3%Fujian22.5%23.0%17.0%17.5%22.0%22.6%24.2%Jiangxi23.0%29.5%23.0%23.5%29.0%30.0%25.4%Shandong8.5%11.0%9.5%10.4%10.5%11.6%7.3%Henan14.0%18.5%13.5%14.5%16.0%17.1%14.6%Hubei36.0%36.5%39.0%39.9%40.0%41.0%43.0%Hunan50.5%56.5%51.5%52.4%51.5%52.4%50.4%Guangdong29.4%27.8%31.0%31.4%29.5%30.0%32.4%Guangxi50.4%44.1%51.0%51.4%50.0%50.5%51.6%Hainan10.0%11.5%11.0%11.5%11.5%12.0%13.3%Chongqing47.0%45.0%47.5%47.5%45.0%45.3%49.2%Sichuan91.0%88.5%80.0%80.4%80.0%80.4%83.5%Guizhou29.2%21.6%33.5%34.0%31.5%32.0%35.6%Yunnan80.0%70.0%80.0%81.0%80.0%81.2%85.6%Xizang59.0%68.5%nananana83.8%Shan’xi15.5%18.5%17.5%18.4%21.5%22.7%16.0%Gansu41.0%38.0%44.0%45.6%47.0%48.9%46.9%Qinhai58.5%69.0%70.0%71.9%70.0%72.5%64.9%Ningxia23.0%23.0%20.0%22.0%25.0%27.0%23.0%Xinjiang26.5%29.5%25.0%26.5%26.0%27.3%26.0%Targetfornon-hydro-renewableenergyProvince201820202018minrequired2018incentive2020minrequired2020incentive2017Beijing10.5%13.0%10.5%11.6%15.0%16.5%10.4%Tianjing10.5%13.0%10.5%11.6%15.0%16.5%10.4%Heibei10.5%13.0%10.5%11.6%15.0%16.5%10.4%Shanxi13.0%15.0%12.5%13.8%14.5%16.0%12.0%Innermongolia13.0%13.0%18.0%19.8%18.0%19.8%18.3%Liaoning9.0%9.0%10.0%11.0%10.5%11.6%9.2%Jilin16.5%20.0%15.0%16.0%16.5%18.2%16.4%Heilongjiang15.5%22.0%15.0%16.5%20.5%22.6%15.8%Shanghai2.5%3.5%2.5%2.8%3.0%3.3%2.7%Jiangsu5.5%6.5%5.5%6.1%7.5%8.3%5.4%Zhejiang5.0%6.0%5.0%5.5%7.5%8.3%4.2%Anhui11.5%14.5%9.5%10.5%11.5%12.7%8.8%Fujian5.0%7.0%4.5%5.0%6.0%6.6%4.5%Jiangxi6.5%14.5%6.5%7.2%8.0%8.8%6.5%Shandong8.0%10.5%9.0%9.9%10.5%11.6%6.9%Henan8.0%13.5%9.0%9.9%10.5%11.6%8.1%Hubei7.5%11.0%7.5%8.3%10.0%11.0%6.8%Hunan9.0%19.0%9.0%9.9%13.0%14.3%7.2%Guangdong3.0%3.8%3.5%3.9%4.0%4.4%3.2%Guangxi3.0%5.0%4.0%4.4%5.0%5.5%3.0%Hainan4.0%5.0%4.5%5.0%5.0%5.5%4.7%Chongqing3.0%3.5%2.0%2.2%2.5%2.8%2.4%Sichuan4.5%4.5%3.5%3.9%3.5%3.9%3.3%Guizhou4.0%4.8%4.5%5.0%5.0%5.5%4.3%Yunnan10.0%10.0%11.5%12.7%11.5%12.7%14.2%Xizang13.5%17.5%nananana14.0%Shan’xi8.5%11.5%9.0%9.9%12.0%13.2%7.7%Gansu15.0%15.0%15.5%17.1%19.0%20.9%13.8%Qinhai21.0%25.5%19.0%20.9%25.0%27.5%18.5%Ningxia21.0%21.5%18.0%19.8%20.0%22.0%21.0%Xinjiang14.5%14.5%14.5%16.0%16.0%17.6%13.1%资料来源:NEA
InSeptember,theNEApublishedaconsultationdocumentregardingthepromotionofgrid-parityforwindandsolarpower,statingthatlocalauthoritiesineachprovincecouldgrantquotasforsubsidy-freewind/solarprojectsbasedonlocalwind/solarresourceswithouttheNEA’sapproval.Webelievethisisaremarkablesteptowardopeningupthequotaforsubsidy-freeprojects.PowerdemandinChinacouldremainresilientin2019andbeyonddespiteapotentialeconomicslowdownPowerdemandinChinapostedstronggrowthin10M18,up8.7%yoy.Webelievethemajordriversofthiswerestrongpowerdemandfromtheresidential(up11.1%YTD)andtertiarysectors(up13.1%YTD).图表25:Chinapowerconsumptionup8.69%in10M18PowerconsumptionbysectorinChina图表26:Powerdemandfromsoftwareandinternetservicessectorssawstronggrowthin10M1810M2018top10sectorpowerdemand700,000600,000500,000400,000300,000200,000100,000012(GWh)(%)1086420Jan-FebMar-18Apr-18May-18Jun-18Jul-18Aug-18Sep-18Oct-182018Roadtransportation(%)LivestockhusbandryPetro,coalandotherfuelprocessingOtherconstructionanddecotrationMetalproductmanufacturingPipelinetransportationWasteresourcerecyclingOtherminingInternetandrelatedserviceResidentialTertiaryindustrySecondaryindustryPreliminaryindustryYoYtotalpowerconsumptiongrowth(RHS)SoftwareandITservices01020304050607080研究中国资料来源:CEC资料来源:CECTheGSMacroResearchteamforecastsrealGDPgrowthof6.2%/6.1%in2019/20E,downfrom6.6%in2018and6.9%in2017.WeexpectChinapowerdemandtoremainrelativelyresilientin2019andbeyonddespiteapotentialeconomicslowdownduetothefollowingreasons:nWeexpectdemandfromthetertiarysectortocontinuetogrowaswebelievethekeysub-sectorswithstrongpowerdemandgrowth(suchasdatacenterservicesandcloudcomputing,etc.)shouldbemoreimmunetoeconomicvolatility.nWeforecastresidentialdemandtoremainstrongonincreasedelectrificationandthespreadofpower-intensivebehaviors(suchasusinghomeappliancesanddrivingelectricvehicles).nAhighersectorconcentrationratioinenergy-intensivesectors,asaresultofsupply-sidereform,wouldenableleadingplayerstomaintainrelativelyhighutilizationandsupportunderlyingdemandforpowerduringaneconomicslowdown.
研究中国Risingeconomicstodriveinstallations;competitionremainsfierce;leadersstandingoutamidsectorconsolidationWeforecastrapidlydeclininggenerationcostsandanimprovingoperatingenvironmenttodrive150GW/256GWofwind/solarinstallationsin2018-23EwithatotalofRmb1,083bn/Rmb1,040bnincapexinvestment.图表27:WeexpectChinatoadd150/256GWofwind/solarinstallationin2018-23EOursolarandwindinstallationforecastsforChinaWind2017A2018E2019E2020E2021E2022E2023EGenerationBnkwh305.7357.2413.5476.9545.9618.6699.6AccumulatedCapacityGW163.7185.7208.7233.7259.7285.7313.7NewadditionGW15.022.023.025.026.026.028.0CAPEXBnRmb165.0170.2182.5187.2184.6193.2Solar2017A2018E2019E2020E2021E2022E2023EGenerationBnkwh118.2167.3216.0271.5337.2408.7493.0AccumulatedCapacityGW130.3167.3205.8246.3291.3336.3386.3Newaddition-ChinaGW52.837.038.540.545.045.050.0Newaddition-GlobalGW98.888.298.5106.2112.2117.3150.0CAPEXBnRmb167167170185171180资料来源:NEA,GaoHuaSecuritiesResearchWeexpectthegenerationshareofwindandsolarpowertoreach15%in2023E,upfrom7%in2017.图表28:Weexpectthegenerationshareofwindandsolarpowertoreach15%by2023EGenerationmixbypowersource100%90%80%70%60%50%40%30%20%10%0%20172018E2019E2020E2021E2022E2023EThermalHydroWindNuclearSolar资料来源:CEC,GaoHuaSecuritiesResearchAsupstreammanufacturersarevigorouslyexpandingcapacitytoprepareforthegrid-parityera,weexpectupstreamcompetitiontoremainfierce,especiallyinsolar.Weforecasttotalpolysilicon/wafer/modulecapacitytorise43%/18%/9%in2018and22%/17%/12%in2019.Weexpecttheconsolidationinupstreammanufacturingtocontinue,withdivergent
cost-cuttingcapabilities,andweexpectupstreamleaderswith
R&Dandexecutionstrengthtostandout,anddownstreamleaderswithoutstandingoperatingefficiencyandstrongbalancesheetsshouldalsobenefitfromcostreductionsintheupstreamvaluechain.图表29:Capacityexpansionplanofleadingsolarproductmanufacturers600,000500,000400,000300,000200,000100,00002015201620172018E2019ESilicon(tonnes)Wafer(MW)Module(MW)资料来源:Companydata,GaoHuaSecuritiesResearch图表30:WeexpectleaderswithcostadvantagetogainmarketshareamidconsolidationMarketshareofleadingsolarandwindproductmanufacturers图表31:WeexpectdownstreamleaderstoexpandEBITmarginsEBITmarginofleadingdownstreamsolarandwindoperators35%60%25%30%25%20%15%10%5%55%50%45%40%35%20%15%10%5%0%201620172018E2019E2020ELongiSungrowGoldwind30%0%201620172018E2019E2020ELongyuanHNRChint(RHS)Note:GlobalmarketshareforLongiandSungrow,ChinamarketshareforGoldwind资料来源:Companydata,GaoHuaSecuritiesResearch研究中国资料来源:Companydata,GaoHuaSecuritiesResearch
Valuation:Attractiverisk/rewardprofiledespiteshort-termpolicyuncertaintiesWeinitiatecoverageoneightwindandsolarnamesChina’ssolar/windsectorsaretradingatone-yearforwardP/Esof10.7x/6.5xandP/Bsof1.8x/0.9x,belowtheiraveragesoverthepastthreeyears(averageP/E:13.1x/9.7x;averageP/B:2.2x/1.1x).Weviewthecurrentrisk-rewardprofileasattractivedespiteshort-termpolicyuncertainties.图表32:SolarsectorrollingP/E图表33:SolarsectorrollingP/BMax:23x20Max:13x1510Max:9x50255.04.54.03.53.02.52.01.51.00.50.0MAx:4.4xAve:2.2xMin:1.6xNote:MarketcapweightedaverageofLongi/Sungrow/Tongwei/Xinyi/ChintMarketcapweightedaverageofLongi/Sungrow/Tongwei/Xinyi/Chint资料来源:Wind,GaoHuaSecuritiesResearch资料来源:Wind,GaoHuaSecuritiesResearch图表34:WindsectorrollingP/E图表35:WindsectorrollingP/BMax:20x2015Max:13x10Max:8x50251.81.61.41.2Ave:1.6xAve:1.1x1.00.80.60.40.20.0Min:0.7x研究中国MarketcapweightedaverageofLongyuan/HNR/GoldwindMarketcapweightedaverageofLongyuan/HNR/Goldwind资料来源:Wind,GaoHuaSecuritiesResearch资料来源:Wind,GaoHuaSecuritiesResearchInthewindsegment,weinitiatecoverageofHNRandGoldwind-HatBuyandGoldwind-AandLongyuanatNeutral.Insolar,weinitiatecoverageofLongi,TongweiandZhejiangChintatBuy,SungrowatNeutralandXinyiatSell.
研究中国图表36:CoveragesummaryLongiChintTongweiSungrowXinyi601012.SS601877.SS600438.SS300274.SZ0968.HK2018EV/EBITDA15.410.111.19.29.72019EV/EBITDA11.78.07.57.18.4Historicalaverage14.110.69.419.112.7Histroricalmean12.69.78.718.610.0Peer’saverage16.710.410.28.67.4Peer’s18-20EBITDAcagr22%17%13%8%11%Company18-20EEBITDAcagr31%25%35%26%18%2019EEBITDA4,3876,7815,0921,5683,6172019ENetdebt(1,100)2,6764,091(2,614)6,718TargetmultipleBenchmark16.510.510.2Historicalaverageof8.5peergroup7.4Targetprice26.332.312.311.02.6CurrentPrice18.223.58.79.22.9PricecurrencyCNYCNYCNYCNYHKDUpside45%38%42%19%-8%RatingBUYBUYBUYNeutralSellImplied2019P/E23.014.815.715.38.6Implied2020P/E16.611.312.011.77.4Historicalmedianlevel(2013-18)23.316.523.4188.9LongyuanHNRGoldwind-HGoldwind-A0916.HK0958.HK2208.HK002202.SZ2018EV/EBITDA6.26.210.614.32019EV/EBITDA5.65.98.511.4Historicalaverage7.37.410.715.0Histroricalmean7.47.410.714.6Peer’saverage8.08.010.210.2Peer’s18-20EBITDAcagr5%5%15%15%Company18-20EEBITDAcagr6%6%29%29%2019EEBITDA17,97410,8135,3405,3402019ENetdebt58,94142,31920,52420,524Targetmultiple5.76.510.012.31stdbelowhistorical0.5stdbelowhistoricalHistoricalaverageof1stbelowBenchmarkaverageaveragepeergrouphistoricalaverageTargetprice6.13.010.412.7CurrentPrice5.42.17.610.8PricecurrencyHKDHKDHKDCNYUpside13%42%37%18%RatingNeutralBUYBUYNeutralImplied2019P/E9.48.18.810.8Implied2020P/E8.47.17.18.7Historicalmedianlevel(2013-18)13.18.49.312.9资料来源:Companydata,GaoHuaSecuritiesResearchExcludingLongiandZhejiangChint,our2018estimatesare0%-6%belowconsensus,our2019estimatesarebroadlyinlinewithconsensus,andour2020estimatesare0%-20%above(exceptforLongyuan).
研究中国图表37:Our2020estimatesare2%-20%aboveconsensusGHnetincomeestimatevs.consensusRating2018E(Rmb/HKDmn)GHestimate2019E(Rmb/HKDmn)2020E(Rmb/HKDmn)VS2018Econsensus2019E2020EGoldwind-ANeutral3,3864,1985,202-6%-1%5%Goldwind-HBuy3,3864,1985,202-6%-1%5%LongyuanNeutral4,7535,2535,861-2%-3%-1%HNRBuy3,5793,8794,4380%-1%2%LongiBuy2,5373,1984,4191%7%20%SungrowNeutral8641,0411,365-4%-4%3%XinyiSell1,9732,3192,720-4%-1%2%ChintBuy3,7114,6326,0681%6%16%TongweiBuy1,8883,0483,997-5%3%11%ThereportingcurrencyforXinyiisHKD,allothersareCNY资料来源:Companydata,Wind,Bloomberg,GaoHuaSecuritiesResearchWeadoptEV/EBITDAastheprimaryvaluationmethodologyforoursolarandwindcoverageaswehavefoundthathistoricalmultiplesarehighlyco-relatedtoEBITDAgrowth,givingusareliableandmeasurablebenchmarkacrossthesectors.Weselectthecomparablepeergroupasavaluationreferencebasedonthenatureofeachcompany’sbusiness.Weapplytheaveragehistoricalmultipleofthepeergrouptoourcoverage(exceptforLongyuan,HNRandGoldwind-A).ForLongyuanandHNR,weapplymultiplesthatare-1std/0.5stbelowthehistoricalaveragestoreflectthede-ratingsincethebeginningof2018duetoinvestorconcernsonsubsidypaymentandutilization.WehavereflectedourmorepositiveviewsinourestimatesforthetwocompaniesaswebelievetheseissuescouldimprovegraduallyasRPSisreinforced.Weapply1stdbelowthehistoricalaveragetoGoldwind-Aasithasbeentradingatanaverage47%premiumoverGoldwind-H,whichweattributetodifferingperceptionsonthewindinstallationoutlookamongon-shoreandoffshoreinvestors.
研究中国图表38:SummaryofourvaluationframeworkUpside/ValuationTargetCompanyRatingPricetargetdownsidemethodologymultipleBenchmarkRationale(%)(x)SolarLongiBuy26.3Rmb/sh45%EV/EBITDA16.5HistoricalaverageLongi’scurrentEV/EBITDAwasslightlyhigherthantheaverageofpast5-yearrange,butofpeergrouplowerthanhistoricalaverageofcomparablepeergroup.Withasector-leadinggrowthoutlook,weexpectthecompanytotradeuptoaverageofcomparablepeersgroup.ChintBuy32.3Rmb/sh38%EV/EBITDA10.5HistoricalaverageChint’scurrentEV/EBITDAwasbelowaverageofitspast5-yearrange,andalsolowerofpeergroupthanhistoricalaverageofcomparablepeergroup.Withasector-leadinggrowthoutlook,weexpectthecompanytotradeuptoaverageofcomparablepeersgroup.TongweiBuy12.3Rmb/sh42%EV/EBITDA10.2HistoricalaverageTongwei’scurrentEV/EBITDAislowerthanaverageofitspast5-yearrange,andalsoofpeergrouplowerthanhistoricalaverageofcomparablepeergroup.Withasector-leadinggrowthoutlook,weexpectthecompanytotradeuptoaverageofcomparablepeersgroup.SungrowNeutral11.0Rmb/sh19%EV/EBITDA8.5HistoricalaverageSungrow’scurrentEV/EBITDAislowerthanaverageofpast5-yrrangeandcomparableofpeergrouppeer’spast5-yraverage.Withasector-leadinggrowthoutlook,weexpectthecompanytotradeuptoaverageofcomparablepeersgroup.XinyiSell2.6HKD/sh-8%EV/EBITDA7.4HistoricalaverageXinyi’scurrentEV/EBITDAislowerthanhistoricalaverage,buthigherthancomparableWindofpeergrouppeershistoricalaverage.AlthoughwebelieveXinyioperateswithmorediversifiedbusinessandbetterprofitabilities□andgrowthoutlookagainstitspeers.Webelieveitsvaluationpremium□isunjustifiedasmostofourpreferredpicksaretrading□atbelowaveragemultipleofpeersgroup.HNRBuy3.0HKD/sh42%EV/EBITDA6.5-0.5stdofhistoricalHNR’scurrentEV/EBITDAwaslowerthanaverageofpast3-yrrangeandcomparableaveragepeershistoricalaverage.Sincethebeginningof2018,HNRhasbeentradingbetweenpast3-yraverageand1stdbelowaverage.Itappearsthereisade-ratingin2018comparedtotheaverageof2016/17,duetoinvestors’concernonsubsidypaymentandutilization.Wehavediscountedourmorepositiveviewinourestimates,andadopt0.5stdbelowhistoricalaverage(medianofYTDrange)astargetmultiple.Goldwind-HBuy10.4HKD/sh37%EV/EBITDA10.0HistoricalaverageGoldwind-H’scurrentEV/EBITDAislowerthantheaverageofpast5-yrrange,alsolowerofpeergroupthanhistoricalaverageofpeergroup.Withagrowthoutlookhigherthansectoraverage,weexpectthecompanytotradeuptohistoricalaverageofpeergroup.LongyuanNeutral6.1HKD/sh13%EV/EBITDA5.7-1stdofhistroicalLongyuan’scurrentEV/EBITDAwaslowerthanaverageofpast3-yrrangeandaveragecomparablepeershistoricalaverage.Sincethebeginningof2018,Longyuanhasbeentradingbetweenpast3-yraverageand1stdbelowaverage.Itappearsthereisade-ratingin2018comparedtotheaverageof2016/17,duetoinvestors’concernonsubsidypaymentandutilization.Wehavediscountedourmorepositiveviewinourestimates,andadopt1stdbelowhistoricalaverage(0.5stdbelowHNR’stargetmultipleonlowerEBITDAgrowthoutlook)astargetmultiple.Goldwind-ANeutral12.7Rmb/sh18%EV/EBITDA12.3-1stdofhistoricalGoldwind-A’scurrentEV/EBITDAislowerthanaverageofpast5-yrrange.Goldwind’sA-averagesharehas47%averagepremiumoverH-sharesincethebeginningof2013.Webelievethisisduetodifferentperceptionofwindinstallationoutlookfromon-shoreandoff-shoreinvestors.Weapply1stdbelowhistoricalaverageastargetmutiple.资料来源:GaoHuaSecuritiesResearch
研究中国图表39:ValuationtableTickerCompanyMktCapUSDMnPriceLoccurEVLoccur2018P/E201920202018P/B201920202018ROE20192020Gearning20172018EV/EBITDA20192020Windmanufacturer2208HKEquityXINJIANGGOLD-H5,143.177.5554,9737.96.45.21.10.90.814.115.717.260.010.68.56.9002202CHEquityXINJIANGGOLD-A5,135.8010.7049,79711.29.17.31.51.31.214.115.717.280.614.311.49.1VWSEUEquityVESTASWINDSYST16,071.95514.009,87716.815.510.84.74.64.227.229.239.2(107.9)8.37.35.8SGRESMEquitySIEMENSGAMESAR9,896.5212.806,91119.016.413.91.41.41.5(1.6)0.44.4(10.4)9.18.57.8NDX1EUEquityNORDEXSE952.238.65962nana18.11.01.11.0(8.7)(6.6)5.711.112.89.85.4Average13.711.811.11.91.91.79.010.916.7Median11.29.113.91.41.31.214.115.717.2Windoperator916HKEquityCHINALONGYUAN-H5,606.405.45121,9859.28.37.51.00.90.811.011.211.4136.26.86.35.7958HKEquityHUANENGRENEWA-H2,894.502.1473,0476.35.85.10.80.70.713.713.213.5192.16.25.94.81798HKEquityCHINADATANGC-H949.691.0257,1465.84.94.30.60.50.511.211.711.9324.07.97.26.7EDPREUEquityEDPRENOVAVEISS7,564.807.6410,48626.227.126.21.01.01.04.03.83.836.18.78.78.5Average11.811.510.70.90.80.710.010.010.2Median7.87.16.30.90.80.711.111.411.6Wind-Average12.811.610.91.41.31.29.510.413.4Wind-Median9.58.110.11.11.11.012.613.614.4Polysilicon600438CHEquityTONGWEICO-A4,897.158.7050,62417.911.18.42.21.91.613.318.520.323.711.17.55.8DQUSEquityDAQONEWENE-ADR313.4924.378045.24.73.00.50.50.410.79.615.039.86.55.63.7600089CHEquityTBEACOLTD-A3,716.016.9059,43711.310.28.80.80.70.77.57.88.648.612.010.79.1Average11.58.76.81.21.00.910.512.014.7Median11.310.28.40.80.70.710.79.615.0Wafer601012CHEquityLONGIGREENEN-A7,339.9118.1476,76120.015.811.53.02.52.016.217.019.328.415.411.78.13800HKEquityGCL-POLYENERGY1,137.970.4973,29413.98.26.30.40.40.42.14.15.2172.48.37.46.8002129CHEquityTIANJINZHONG-A2,830.717.0142,43773.850.114.3nanana3.75.49.377.6nananaAverage35.924.710.71.71.41.27.38.811.3Median20.015.811.51.71.41.23.75.49.3Cell/ModuleJKSUSEquityJINKOSOLAR-ADR437.2211.1515,5065.915.615.41.51.51.56.11.71.7154.55.76.97.1CSIQUSEquityCANADIANSOLARI937.8916.013,5135.58.914.50.80.80.715.68.75.1235.95.86.27.1FSLRUSEquityFIRSTSOLARINC4,406.4242.044,03429.616.312.50.90.8na2.95.06.1(59.2)16.68.35.9SPWRUSEquitySUNPOWERCORP816.885.792,460nananananana(855.7)(31.8)(38.3)443.520.08.27.7Average8.314.413.11.11.01.1(207.8)(4.1)(6.4)Median5.716.013.50.90.81.14.53.33.4Inverter300274CHEquitySUNGROWPOWER-A2,003.489.5227,60216.013.310.11.81.61.411.812.814.813.99.27.15.1002518CHEquitySHENZHENKSTAR-A695.008.238,59812.310.58.61.91.71.414.815.317.3(38.9)21.419.213.3SEDGUSEquitySOLAREDGETECHNO1,711.5737.411,30211.519.634.13.83.63.537.019.811.2(86.4)10.318.531.8Average13.314.517.62.52.32.121.216.014.4Median14.211.99.41.91.61.413.314.016.0PVGlass968HKEquityXINYISOLARHLDS2,823.772.8828,49311.29.58.12.01.81.618.519.620.656.19.78.46.96865HKEquityFLATGLASSGRO-H493.072.142,93810.37.46.41.11.00.910.714.214.213.83.62.52.0Average10.88.47.21.51.41.214.616.917.4Median10.88.47.21.51.41.214.616.917.4EPC/Solarfarmoperator601877CHEquityZHEJIANGCHINT-A7,345.8323.5564,19013.410.88.22.11.81.517.018.120.037.810.18.06.1451HKEquityGCLNEWENERGY708.040.2943,0986.45.65.60.70.60.511.711.810.5375.88.87.97.81250HKEquityBJENTCLEAN837.550.1017,0124.54.33.70.80.60.517.914.610.035.06.14.64.1RUNUSEquitySUNRUNINC1,466.3913.111,97055.614.213.71.82.85.6(38.2)(45.0)(73.3)66.6nana74.4PEGIUSEquityPATTERNENER-A1,910.9119.485,17113.0nana1.71.92.113.4(0.0)1.177.313.713.112.8AverageMedian18.613.08.75.67.88.21.41.71.51.82.11.54.413.4(0.1)11.8(6.3)10.0Solar-average16.413.210.51.61.41.4(25.0)8.27.5Solar-Median12.111.08.91.61.41.212.010.712.5资料来源:Bloomberg,Wind,GaoHuaSecuritiesResearch
研究中国RisksDisappointingFiTpoliciesin2019.Althoughwebelievesolarandwindpoweraregraduallymovingfromasubsidy-driventoacost-drivenmodel,currentprojectreturnsofsolarandwindpowerstillrelyonsubsidies.DisappointingFiTpolicieswouldreducetheprojectedreturnofsolarandwindpowerandhurtunderlyingdemandintheshortterm.Disappointingpolicyonsolarprojectquotain2019.Althoughwebelievesolarandwindpoweraregraduallymovingfromasubsidy-driventocost-drivenmodel,mostsolarandwindpowerprojectsneedgovernmentapprovaltogetconnectedtothegrid.Assuch,iftheNEApublishesadisappointingpolicyonprojectquotasin2019,underlyinginstallationanddemandwouldbesubstantiallyimpacted.DisappointingRPSpolicy.TheNEAhaspublishedthreeversionsofconsultationdocumentsforRPS,andthefinalversioncoulddifferfromthelatestconsultationdocument.IftheRPSpolicyturnsouttobedisappointing,webelievesentimentforrenewableenergyinvestmentinChinawouldbehurt.Over-supplyfromupstreamsolarproductmanufacturers.Ifupstreamsolarproductmanufacturersexpandcapacitymorethanexpected,over-supplyinupstreammanufacturingwouldincreasecompetitionwithinthesectorandhurttheprofitabilityofrelatedmanufacturers.
研究中国COMPANYANALYSIS
研究中国LongiGreen(601012.SS):Drivingglobalmonopenetration;initiateatBuyLongiisthelargestmonowaferandmodulemakerintheworldwithcapacitiesof15GWforwafersand6.5GWformodulesasofend-2017.Webelieveitskeyadvantageliesinitssector-leadingR&Dandexecutioncapabilities,whichhavedrivencontinuouscostreductionandrapidcapacityexpansion.Over2012-17,Longisuccessfullygrewitswafershipmentsfrom826MWto10.7GWwhileitsglobalmarketshareexpandedto11%from3%.Rapidcapacityexpansionandhigh-efficiencyproductofferingstodriveglobalshare.WeexpectLongi,throughanaggressivecapacityexpansionandpricingstrategy,torecordCAGRsof47%/46%foritswafer/moduleexternalshipmentsin2018-20.Withwafer/moduleASPsdecliningby35%/22%in2018,9%/7%in2019and5%/5%in2020onourestimates,weexpectLongitorecordCAGRsof18%/38%forwafer/modulerevenuein2018-20.LeadingR&Dstrengthtodrivecost-reduction.WeestimatethatLongi,byleveragingitssector-leadingR&Dcapability,reducednon-siliconcostforitswafersby78%in2012-17,anditsproductioncostformodulesby36%in2015-17.In2018-20,weexpectcontinuedefficiencyimprovementstodrivefurther22%and21%reductionsinitswafer’snon-siliconcostanditsmodule’sprocessingcost.Asaresultof35%and22%ASPdeclineforwafers/modulesin2018,weexpectgrossmarginforLongi’swaferandmodulestodeclinefrom32.7%/30.7%in2017to13.2%/20.6%in2018,butgraduallyrecoverto15.8%/21.1%in2019and15.8%/21.4%in2020ascostreductionscatchup.Drivingglobalmonopenetration:WeexpectLongitorecorda32%netincomeCAGRin2018-20.WelikeLongi’ssector-leadingR&DandexecutioncapabilitiesandexpectLongitofurtherdriveglobalshareonrapidcapacityexpansionandcontinuedcostreductions.Giventhesepositives,andwith45%upsidetoour12-monthtargetpriceofRmb26.3,weinitiatecoverageonLongiatBuy.
研究中国图表40:FinancialsummaryProfitmodel(Rmbmn)12/1712/18E12/19E12/20ETotalrevenue16,362.322,775.527,709.538,409.3Costofgoodssold(11,081.8)(18,346.0)(22,050.5)(30,381.9)SG&A(1,328.7)(1,776.5)(2,161.3)(2,995.9)R&D--------Otheroperatingprofit/(expense)(151.6)(136.5)(122.8)(122.8)EBITDA4,394.83,297.74,386.66,175.8Depreciation&amortization(594.6)(781.2)(1,011.8)(1,267.1)EBIT3,800.12,516.53,374.84,908.7Interestincome75.775.791.6101.1Interestexpense(270.0)(338.2)(435.4)(513.0)Income/(loss)fromuncons.subs.--------Others411.9650.0650.0650.0Pretaxprofits4,017.72,904.03,680.95,146.7Incometax(468.3)(377.5)(496.9)(746.3)Minorities15.110.813.618.8Netincomepre-preferred3,564.52,537.23,197.64,419.2Preferreddividends--------Netincome(pre-exceptionals)3,564.52,537.23,197.64,419.2Posttaxexceptionals--------Netincome3,564.52,537.23,197.64,419.2EPS(basic,pre-except)(Rmb)1.280.911.151.58EPS(basic,post-except)(Rmb)1.280.911.151.58EPS(diluted,post-except)(Rmb)1.280.911.151.58DPS(Rmb)0.180.090.110.16Dividendpayoutratio(%)14.110.010.010.0Freecashflowyield(%)(6.2)(0.1)(0.7)2.7Growth&margins(%)12/1712/18E12/19E12/20ESalesgrowth41.939.221.738.6EBITDAgrowth77.0(25.0)33.040.8EBITgrowth76.7(33.8)34.145.5Netincomegrowth130.4(28.8)26.038.2EPSgrowth130.4(28.8)26.038.2Grossmargin32.319.420.420.9EBITDAmargin26.914.515.816.1EBITmargin23.211.012.212.8Cashflowstatement(Rmbmn)12/1712/18E12/19E12/20ENetincomepre-preferreddividends3,564.52,537.23,197.64,419.2D&Aadd-back594.6781.21,011.81,267.1Minoritiesinterestsadd-back(15.1)(10.8)(13.6)(18.8)Net(inc)/decworkingcapital808.0642.9(64.1)746.9Otheroperatingcashflow(3,710.1)------Cashflowfromoperations1,241.93,950.54,131.76,414.5Capitalexpenditures(3,945.2)(4,000.0)(4,500.0)(5,000.0)Acquisitions--------Divestitures--------Others171.1------Cashflowfrominvestments(3,774.0)(4,000.0)(4,500.0)(5,000.0)Dividendspaid(common&pref)(199.6)(358.9)(253.7)(319.8)Inc/(dec)indebt3,576.52,200.01,700.01,200.0Commonstockissuance(repurchase)198.6------Otherfinancingcashflows1,686.1------Cashflowfromfinancing5,261.61,841.11,446.3880.2Totalcashflow2,729.51,791.61,078.02,294.7Balancesheet(Rmbmn)12/1712/18E12/19E12/20ECash&equivalents8,546.010,337.711,415.613,710.4Accountsreceivable6,131.38,611.010,248.713,153.9Inventory2,380.43,970.84,530.95,826.7Othercurrentassets1,869.61,869.61,869.61,869.6Totalcurrentassets18,927.424,789.128,064.934,560.5NetPP&E10,803.514,031.917,529.621,277.5Netintangibles212.9203.4193.9178.9Totalinvestments515.2515.2515.2515.2Otherlong-termassets2,424.73,142.53,650.04,289.5Totalassets32,883.742,682.049,953.560,821.6Accountspayable7,350.212,063.114,196.919,144.8Short-termloans1,611.81,811.82,011.82,211.8Othercurrentliabilities3,378.13,378.13,378.13,378.1Totalcurrentliabilities12,340.117,253.119,586.824,734.7Long-termdebt4,804.06,804.08,304.09,304.0Otherlong-termliabilities1,495.51,495.51,495.51,495.5Totallong-termliabilities6,299.48,299.49,799.410,799.4Totalliabilities18,639.625,552.529,386.335,534.1Preferredshares--------Totalcommonequity14,195.417,091.520,542.825,281.7Minorityinterest48.838.024.45.7Totalliabilities&equity32,883.742,682.049,953.560,821.6BVPS(Rmb)5.096.127.369.06Ratios12/1712/18E12/19E12/20ECROCI(%)5.422.122.525.4ROE(%)29.416.217.019.3ROA(%)13.76.76.98.0Inventorydays59.263.270.462.2Receivablesdays111.1118.1124.2111.2Payabledays171.7193.1217.3200.3Netdebt/equity(%)(15.0)(10.1)(5.3)(8.7)Interestcover-EBIT(X)19.69.69.811.9Valuation12/1712/18E12/19E12/20EP/Ebasic(X)12.220.716.411.9P/B(X)3.13.12.62.1EV/EBITDA(X)9.415.411.78.1EV/GCI(X)2.92.92.32.0Dividendyield(%)1.20.50.60.8Note:Lastactualyearmayincludereportedandestimateddata.Source:Companydata,GoldmanSachsResearchestimates.资料来源:Companydata,GaoHuaSecuritiesResearch
Theworld’slargestmakerofmonowafersandmodulesIncorporatedin2010,Longiistheworld’slargestmakerofmonowafersandmoduleswith15GWofwaferand6.5GWofmodulecapacityasofend-2017.In2017,wafers/modulescontributed35%/56%ofLongi’srevenue,withgrossmarginsof33%/31%.WebelieveLongi’skeyadvantagesare:1)itssector-leadingR&Dandexecutioncapability,whichhavedrivencontinuedcostreductionsandrapidcapacityexpansion;2)anintegratedbusinessmodelcoveringhigh-efficiencywafer,cellandmodulemanufacturing,whichhasallowedthecompanytopromoteitsground-breakingmonosolutiondirectlytoend-users.In2012-17,Longigrewitswafershipmentsto10.7GWfrom826MW,aCAGRof67%,whileitsglobalmarketshareexpandedto11%from3%;atthesametime,grossmarginofthewafersegmentrosefrom13%to33%.图表41:Longi’swafershipmentsrecordedaCAGRof67%in2012-17Historicalwafer/modulecapacityandshipment图表42:HistoricalrevenuebysegmentandYoYgrowthfortotalrevenue70,00060,00050,00040,00030,00020,00010,00002012201320142015201620172018E2019E2020E12%(MW)10%8%6%4%2%0%45,00040,00035,00030,00025,00020,00015,00010,0005,0000(Rmbmn)2015201620172018E2019E2020E100%90%80%70%60%50%40%30%20%10%0%WafercapacityModulecapacityWafershipmenModuleshipmentGlobalmarketshare(RHS)WaferModuleCellSolarpowerOtherYoYgrowth(RHS)资料来源:Companydata,GaoHuaSecuritiesResearch资料来源:Companydata,GaoHuaSecuritiesResearch图表43:Grossmarginbysegment图表44:HistoricalEBIT,EBITmarginandR&DexpasapercentageofrevenueHistoricalEBIT,EBITmarginandR&Dexpasa%ofrev40%35%30%25%20%15%10%5%0%2015201620172018E2019E2020EBlendedWaferModule55004500350025001500500-500EBITEBITmarginR&Dexpas%ofrev25%(Rmbmn)2015201620172018E2019E2020E20%15%10%5%0%研究中国资料来源:Companydata,GaoHuaSecuritiesResearch资料来源:Companydata,GaoHuaSecuritiesResearch
图表45:Longi’smarketshareexpandedto11%in2017from3%in2012Productionvolumeofleadingwafermakers(2017)(MW)30,00012%25,00010%20,0008%15,0006%10,0004%5,0002%-0%201220132014201520162017CanadianSolarZhonghuanJinkoSolarLongiGCLLongi’smarketshare(RHS)资料来源:CompanydataRapidcapacityexpansionandhigh-efficiencymonosolutionstodriveglobalshareWebelieveLongiisnotjustbest-positionedtorideonrisingglobalmonopenetration,butcouldalsobethekeydriverofthechange.Accordingtoitsstrategicplanfor2018-20,Longiisaimingtoexpandmonowafercapacityfrom15GWbyend-2017to28GWbyend-2018,36GWbyend-2019and45GWbyend-2020.Inaddition,Longitargetsareductioninthenon-siliconcostofitswaferstolessthanRmb1/pic,andcouldsupport22.5%conversionefficiencyforPERCcellproductswithlessthan1%ofLID.图表46:Capacityofleadingwafermakers(2017)Capacityofleadingwafermakers(2017)图表47:Longiaimstobuild45GWofwafercapacitybyend-2020CapacityexpansionplanofleadingwafermakersGCLLongiJinkoSolarZhonghuanCanadianSolarLDKJASolarYingliGreenEnergyReneSola(wafer)TrinaNanBoSFCE(SuntechPower)SolargigaEnergy05,00010,00015,00020,00025,00030,00035,00050,00045,00040,00035,00030,00025,00020,00015,00010,0005,0000201620172018E2019E2020ECanadianSolarJinkoSolarZhonghuanGCLLongi研究中国资料来源:Companydata,PVinsight资料来源:Companydata,PVinsight,GaoHuaSecuritiesResearchWebelieveLongicouldusethiscapacityexpansiontocapturethegrowth
opportunityfromoverseasmarketsandfurtherdriveglobalmarketshareonthebackofahigh-efficiencymonosolution.Longi’sglobalsharewasc.11%in2017,and74%ofits
revenueisderivedfromtheChinamarket.SinceLongibeganaddingcapacityaggressivelyin2015andsuccessfullyrolledoutground-breakinghigh-efficiencymonomoduleswithrecordlowLIDfeaturesinthesameyear,Longi’sMOP-typemoduleproductshaveconsistentlydeliveredbettergenerationperformancethanregularmulti-modules.Asaresultofthissector-leadingcostperformance,Longi’swafershipmentsgrewto10.7GWfrom2.7GWanditsmoduleshipmentsgrewto4.7GWfrom821MWin2015-17.Asaresultofitsrobustshipments,LongiChina’slargestmakerofmonoproductsdroveglobalmonopenetrationfrom20%in2016to28%in2017.图表48:Longihasconsistentlyrolledoutground-breakinghigh-efficiencymodulesBi-facialmonomodule-LR6-72BP(355-370W)-LR6-60BP(290-310W)PERCmonomodule-LR6-72PE(355-370W)-LR6-60PE(295-310W)Regularmonomodule-LR6-72(335-345W)-LR6-60(280-295W)25yearpowerwarrantyannualpowerattenuation:0.55%Longi’smonomoduleofferings资料来源:Companydata图表49:Longi’shigh-efficiencymoduleoffersbettergenerationperformanceGenerationperformanceofLongiHi-MO1P-typemoduleandregularmultimodule图表50:Globalmonopenetration2,500(Kwh/year)2.5%120%2,0002.0%100%1,5001.5%80%60%1,0001.0%40%5000.5%20%0DatongCologneRiyadhLosangelasChennaiHi-MO1MultimodulesGenerationpremium(RHS)0.0%0%201620172018201920202021MultiMono
研究中国资料来源:Companydata资料来源:BNEF
图表51:Chinasalesaccountedfor74%andutilizationcloseto100%in2017Revenuebreakdown,waferandmoduleutilizationandsales-to-productionratio(Rmbmn)74%79%71%18,000100%16,00014,00012,00010,0008,0006,0004,0002,00090%80%70%60%50%40%30%20%10%研究中国00%201520162017ChinaAsia-pacificAmerciaEuropeAfricaWaferutilization(RHS)Moduleutilization(RHS)Wafersales-to-production(RHS)Modulesales-to-production(RHS)资料来源:CompanydataAsnewcapacitycameintooperationin4Q17andLongiactivelylowereditswaferpricestoimprovethecostperformanceagainstmulti-products,Longi’soverseasmoduleshipmentsgrew18xyoyto687MWin1H18.Webelieve2018marksthebeginningofahigh-growthperiodforLongi’soverseasshipmentsandexpectitsglobalsharetofurtherexpandonrapidcapacityadditionsandcontinuedupgradeinitshigh-efficiencyproductofferings.图表52:WeexpectLongi’swaferandmodulecapacitytoreach45GWand18GWbyend-2020Waferandmodulecapacityforecast(MW)50,00045,00040,00035,00030,00025,00020,00015,00010,0005,0000201620172018E2019E2020EWaferModule资料来源:Companydata,GaoHuaSecuritiesResearchWeexpectLongitogrowitswafershipmentsfrom18.5GWin2018to32.5GWin2020(aCAGRof33%);weforecastmoduleshipmentstogrowfrom6.8GWin2018to14.5GWin2020(aCAGRof46%).Inordertofurtherimprovecostperformanceagainstmulti-productsandexpandmarketshareamidlower
2H18demandinChina,weexpectLongitolowerASPsforitswafer/modulesby35%/22%in2018.For2019-20,weexpect
lessASPdeclineasmarketconsolidationeasesoffin2018;weforecastwaferandmoduleASPstoseecompounddeclinesof7%/6%in2019-20.Ontherevenueside,weexpectLongi’swafer/modulerevenuetoincrease29%/51%toRmb7.4bn/Rmb13.9bnin2018,up33%/17%toRmb9.8bn/Rmb16.2bnin2019andup4%/62%toRmb10.2bn/Rmb26.3bnin2020.图表53:Weexpect33%and46%CAGRsforwaferandmoduleshipmentsin2018-20Waferandmoduleshipment/ASPforecast图表54:WeexpectLongi’swaferandmodulerevenuetosee18%/38%CAGRsin2018-20Waferandmodulerevenue/yoygrowthforecast35,00030,00025,00020,00015,00010,0005,0000(MW)(Rmb/w)201620172018E2019E2020EWafershipmentModuleshipmentWaferASP(RHS)ModuleASP(RHS)4.54.03.53.02.52.01.51.00.50.030,00025,00020,00015,00010,0005,0000(Rmbmn)201620172018E2019E2020EWaferrevenueModulerevenueWaferrevenueyoygrowth(RHS)Modulerevenueyoygrowth(RHS)250%200%150%100%50%0%研究中国资料来源:Companydata,GaoHuaSecuritiesResearch资料来源:Companydata,GaoHuaSecuritiesResearchTosupportitscapacityexpansionplan,weestimateLongi’scapextobeRmb4bn/Rmb4.5bn/Rmb5.0bnin2018-20.Asofend-2017,LongihasanetcashbalanceofRmb8.5bnandoperatingcashflowamountedtoRmb1.2bnin2017.LongihasproposedraisingRmb3.9bnbyissuingnomorethan838mnnewsharestoexistingshareholders.Accordingtothisrightsissueplan,theproceedsraisedwouldbeusedtofundtheconstructionof:1)5GWmonocellcapacity;2)5GWmonomodulescapacity;and3)workingcapital.Althoughweestimatethiscouldresultinac.8%increaseinthetotalnumberofsharesassumingtherightsareissuedatthelastclosingpriceofDecember17,2018,webelieveLongicaneffectivelydriveitsglobalshareandnetincomebasedonitssolidtrackrecord.In2015-17,LongiraisedanaggregateofRmb7.7bntofunditscapacityexpansionplanandtotalsharecapitalincreasedby264%.However,thecompanymanagedtoexpanditsROEfrom11.8%to30.1%onrapidearningsgrowth.
图表55:Historicaloperatingcashflow/netcashflow/cashbalancevs.capex图表56:In2015-17,Longi’sROEexpandedto30.14%from11.8%afteritraisedRmb7.7bnHistoricalfinancingandROE(Rmbmn)9,0008,0007,0006,0005,0004,0003,0002,0001,0000201520162017OperatingcashflowNetcashflowCashbalanceCAPEX3,5003,0002,5002,0001,5001,0005000201520162017ProceedraisedROE35%(Rmbmn)30%25%20%15%10%5%0%资料来源:Companydata资料来源:CompanydataLeadingR&DstrengthtodrivecostreductionWebelievecontinuedinvestmentinR&Dhasbeenthekeydriverofthesector-leadingcostperformanceforLongi’smonoproducts.In2012-17,LongiinvestedRmb24bninR&DwhilemaintainingR&Dexpenseasapercentageofrevenuesatc.5%p.a.In2015-17,themaxvoltageofLongi’smonomodulesrosefrom290Wto334W.图表57:LongihasbeenconsistentlyinvestinginR&DtodrivecostadvantageR&Dexp,R&Dexpas%ofrevandglobalmarketshare(Rmbmn)1,2001,00012%10%图表58:LongihasconsistentlyupgradedtheefficienciesofitsmodulesVoltageof60pcP-typemodule-Longi(W)3503208006004002008%2906%2604%2%23000%201220132014201520162017R&DexpGlobalmarketshareR&Das%ofrev200201520162017AverageMax研究中国资料来源:Companydata资料来源:CompanydataUnlikemostofitspeers,whichpurchasecompletesetsofcrystal-growingequipment,Longiinternallydesignsanddevelopshigh-efficiencycrystal-growingequipmentandcontrollingsoftware;itonlyoutsourcestheproductionofgeneralequipment,whichhasenabledLongitominimizeproductioncostintermsofcapex.Inaddition,Longihasconsistentlyupgradedproductivityofthecrystal-pullingandingotslicingprocesstodrivecostreductions.WeestimateLongiwasabletoreducethenon-siliconcostofitswafersby75%in2012-17,andproductioncostforitsmodulesby41%in2015-17.WeestimateLongi’snon-siliconcostreachedc.US$0.04/wbyend-2017.Goingforward,weexpect
Longitodrivefurthercostreductionsthroughimprovementinitscell’sconversionefficiencies.
图表59:Longihasdrivenwafercostreductionthroughhigh-speed/multiplecrystal-pullingandefficientdiamondwirecuttingtechnologiesProductionprocessofwaferandcoretechnology资料来源:Companydata图表60:Longireduceditsnon-siliconcostby75%in2012-17,andcouldfurtherreduce22%in2018-20ASPandnon-siliconcostofLongi’swafer(Rmb/w)(USD/w)1.41.21.00.80.60.40.20.090.080.070.060.050.040.030.020.01图表61:Longireduceditsproductioncostby41%in2012-17,andcouldfurtherreduce21%in2018-20ASPandproductioncostofLongi’smodule(Rmb/w)4.03.53.02.52.01.51.00.50.02015201620172018E2019E2020EASPNon-siliconcost0.000.02015201620172018E2019E2020EASPProductioncost研究中国资料来源:Companydata,GaoHuaSecuritiesResearch资料来源:Companydata,GaoHuaSecuritiesResearchWeestimateLongicouldlowertheon-siliconcostofitswafersby22%anditsmoduleproductioncostby21%in2018-20.Asaresultofwafer/moduleASPdeclinesof35%/22%ASPin2018,weexpectgrossmarginforLongi’s
wafers/modulestodecline
研究中国from32.7%/30.7%in2017to13.2%/20.6%in2018,butgraduallyrecoverto15.8%/21.1%in2019and15.8%/21.4%in2020ascostreductioncatchesup.图表62:WeexpectLongi’swafer/modulegrossmargintodecline20/10pptto13.2%/20.6%in2018andrecoverto15.8%/21.1%in2019,and15.8%/21.4%in2020Grossmarginofwaferandmodulesegment40%35%30%25%20%15%10%5%0%201620172018E2019E2020EGrossmargin-moduleGrossmargin-wafer资料来源:Companydata,GaoHuaSecuritiesResearchFinancialstatementanalysisP&L:WeexpectLongitodeliver39%revenuegrowthin2018onsolidshipmentgrowthandfurthergrow22%and39%in2019/20.Onthebackof35%/22%wafer/moduleASPdeclinesin2018,weexpectwaferandmodulegrossmarginstofall20/10pptto13.2%/20.6%in2018andgraduallyrecoverto15.8%/21.1%in2019and15.8%/21.4%in2020ascostreductionrecovers.WeexpectEBITmargintofall12pptto11%in2018Eonlowergrossmarginandgraduallyrecoverto12.2%/12.8%in2019/20.WeexpectLongitorecorda32%netincomeCAGRin2018-20.Balancesheet:Atend-2017,Longi’snetgearingwas-15%anditscashbalancewasRmb8.5bn.In2018/19/20,weexpectnetgearingtoincreaseto-10%/-5%/-9%asthecompanyraiseslong-termdebttosupportitscapacityconstructionplans.Cashflow:WeexpectLongitorecordRmb4.0/4.5/5.0bnofcapexin2018-20,mainlytosupportcapacityexpansion.Weexpectthecompany’snetcashflowwillamounttoRmb1.79/1.08/2.30bnin2018-20.
图表63:Summaryofkeyassumptions201620172018E2019E2020EWaferSalesvolume(MW)4,7475,40710,70015,50017,000ASP(Rmb/w)1.071.060.690.630.60Revenue(Rmbmn)5,0755,7537,4019,80910,221Grossmargin18%33%13%16%16%ModuleSalesvolume(MW)1,8471,8471,8471,8471,847ASP(Rmb/w)3.093.093.093.093.09Revenue(Rmbmn)5,7015,7015,7015,7015,701Grossmargin36%31%21%21%21%Totalrevenue(Rmbmn)11,53116,36222,77527,70938,409YoYgrowth94%42%39%22%39%Grossmargin27%32%19%20%21%EBITmargin19%23%11%12%13%Netincome(Rmbmn)1,5473,5652,5373,1984,419YoYgrowth197%130%-29%26%38%资料来源:Companydata,GaoHuaSecuritiesResearchDrivingglobalmonopenetration;initiateatBuyLongiiscurrentlytradingata2019EV/EBITDAof11.7xvs.thehistoricalaverageandmedianof14.1xand12.6x.Longi’scomparablepeershavepostedafive-yearaverageEV/EBITDAof16.7x.Ourdetailedanalysissuggeststhatitspeers’valuationdistributionwasbroadlyrelatedtoEBITDAgrowth.Longi’scurrentEV/EBITDAwasslightlyhigherthantheaverageofitsrangeinthepastfiveyears,butlowerthanthehistoricalaverageofitscomparablepeergroup.WeexpectLongi,withasector-leadinggrowthoutlook,totradeuptotheaverageofitscomparablepeergroup.Webaseour12-monthtargetpriceofRmb26.3onatarget2019EV/EBITDAof16.7x(inlinewiththefive-yearhistoricalaverageofLongi’speergroup).With40%upsidetoourtargetprice,andconsideringourpositiveviewonthecompany’sprospects,weinitiatecoverageofLongiwithaBuyrating.图表64:HistoricalEV/EBITDA图表65:Currentvaluationcomparison40.035.030.025.020.015.010.05.0181614121086420Longi-currentPeers’averageLongi-historical35%30%25%20%15%10%5%0%+1std:20.3xAve:14.1x-1std:8..x0.01/1/20131/1/20141/1/20151/1/20161/1/20171/1/20182018EV/EBITDA2019EV/EBITDA18-20EEBITDAcagr(RHS)研究中国资料来源:Wind,GaoHuaSecuritiesResearch资料来源:Wind,GaoHuaSecuritiesResearch
图表66:HistoricalEV/EBITDAvs.2013-17EBITDACAGR35302520151050ZhonghuanSungrowLongiTBEAGCLAverageMedian13-17EBITDAcagr(RHS)100%90%80%70%60%50%40%30%20%10%0%研究中国资料来源:Wind,GaoHuaSecuritiesResearchKeyrisks:Slower-than-expectedcapacityexpansion.Longiaimstoexpandmonowafercapacityfrom15GWbyend-2017to45GWbyend-2020.Ifitscapacityexpansionturnsoutslowerthanexpected,ourestimateswouldhavedownsiderisk.Lower-than-expectedwaferprices.LowerwaferpriceswoulddragonLongi’sgrossmarginsandposedownsideriskforourestimates.
研究中国ZhejiangChint(601877.SS):Drivingfull-cyclesolarsolution;initiateatBuyDrivingfull-cyclesolarsolution.Asthelargestlow-voltagepowerequipmentmakerinChina,ZhejiangChinttargetsdrivingafull-cyclesolarservicesolutioncoveringupstreamcell/module/invertermanufacturing,midstreamEPCserviceanddownstreamsolarfarmoperationbyleveragingitsstrongfranchiseandcash-flowgenerationinlow-voltageelectricalequipment.ActiveexpansionandoptimizationofprojectportfoliotodrivesolarEPCandoperationrevenue.Leveragingitsstrongfranchiseandcash-flowgenerationinlow-electricalequipment,ZhejiangChinttargetstodriveafull-cyclesolarservicesolutioncoveringupstreamcell/module/invertermanufacturing,midstreamEPCserviceanddownstreamsolarfarmoperation.WeexpectZhejiangChinttorecorda25%CAGRforsolarrevenuein2018-20,mainlydrivenbya45%CAGRfromEPCserviceand19%frompowersales.Low-voltagepowerequipmentre-gainingmomentumpostdistributionrestructure.Thankstoatwo-yeardistributionrestructuringandtheroll-outofthehigh-endKunlunbrand,salesgrowthoflow-voltagepowerequipmentrecoveredto14%in2017,andZhejiangChintfurtherraisedASPby3%-5%in1Q18.WeexpectZhejiangChint’sre-vitalizeddistributionsystemandstrongbrandequitytodrivea13%revenueCAGRforlow-voltagepowerproducts,andweforecastgrossmargintoexpandfrom33.6%in2018to35.6%in2020.Solidgrowthoutlookandundemandingvaluation,initiateatBuy.WeexpectZhejingChinttodelivera28%netincomeCAGRin2018-20.Welikeitsbusinessmodel,whichisbasedondrivinganLCOE-orientedfull-cyclesolarsolution,leveragingitsstrongfranchiseinlow-voltagepowerproductsandleadingexpertiseinsolartech.Giventhesepositives,andwith38%upsidetoour12-monthtargetpriceofRmb32.3(basedon10.5x2019EV/EBITDA),weinitiatecoverageonZhejiangChintatBuy.
研究中国图表67:FinancialsummaryProfitmodel(Rmbmn)12/1712/18E12/19E12/20ETotalrevenue23,416.627,198.131,862.437,418.4Costofgoodssold(16,550.9)(19,095.4)(22,022.2)(25,632.2)SG&A(3,151.2)(3,535.8)(4,142.1)(4,490.2)R&D--------Otheroperatingprofit/(expense)(172.8)(172.8)(172.8)(159.0)EBITDA4,630.75,465.56,780.78,586.1Depreciation&amortization(1,089.1)(1,071.4)(1,255.4)(1,449.1)EBIT3,541.64,394.15,525.37,137.0Interestincome152.0186.8207.1210.2Interestexpense(590.1)(609.7)(642.9)(609.7)Income/(loss)fromuncons.subs.--------Others291.1420.0420.0480.0Pretaxprofits3,394.64,391.25,509.57,217.6Incometax(398.5)(505.0)(633.6)(830.0)Minorities(156.2)(174.9)(243.8)(319.4)Netincomepre-preferred2,839.93,711.34,632.16,068.2Preferreddividends--------Netincome(pre-exceptionals)2,839.93,711.34,632.16,068.2Posttaxexceptionals--------Netincome2,839.93,711.34,632.16,068.2EPS(basic,pre-except)(Rmb)1.341.752.192.86EPS(basic,post-except)(Rmb)1.341.752.192.86EPS(diluted,post-except)(Rmb)1.341.752.192.86DPS(Rmb)0.080.260.330.43Dividendpayoutratio(%)6.015.015.015.0Freecashflowyield(%)(1.5)2.53.06.4Growth&margins(%)12/1712/18E12/19E12/20ESalesgrowth16.116.117.117.4EBITDAgrowth12.318.024.126.6EBITgrowth8.024.125.729.2Netincomegrowth30.030.724.831.0EPSgrowth30.030.724.831.0Grossmargin29.329.830.931.5EBITDAmargin19.820.121.322.9EBITmargin15.116.217.319.1Cashflowstatement(Rmbmn)12/1712/18E12/19E12/20ENetincomepre-preferreddividends2,839.93,711.34,632.16,068.2D&Aadd-back1,089.11,071.41,255.41,449.1Minoritiesinterestsadd-back156.2174.9243.8319.4Net(inc)/decworkingcapital(1,877.5)(1,094.6)(1,266.0)(1,031.4)Otheroperatingcashflow359.9------Cashflowfromoperations2,567.63,863.04,865.26,805.2Capitalexpenditures(3,233.3)(2,577.4)(3,295.4)(3,467.3)Acquisitions--------Divestitures--------Others520.0------Cashflowfrominvestments(2,713.3)(2,577.4)(3,295.4)(3,467.3)Dividendspaid(common&pref)(1,277.3)(115.9)(556.7)(694.8)Inc/(dec)indebt218.2------Commonstockissuance(repurchase)4,777.5------Otherfinancingcashflows(562.0)------Cashflowfromfinancing3,156.5(115.9)(556.7)(694.8)Totalcashflow3,010.81,169.81,013.12,643.1Balancesheet(Rmbmn)12/1712/18E12/19E12/20ECash&equivalents6,226.37,396.18,409.211,052.3Accountsreceivable8,862.810,432.112,395.814,147.2Inventory3,271.33,923.74,585.45,126.4Othercurrentassets2,679.82,679.82,679.82,679.8Totalcurrentassets21,040.124,431.728,070.233,005.8NetPP&E16,092.717,645.719,734.121,802.1Netintangibles344.2297.2248.8199.0Totalinvestments1,885.31,885.31,885.31,885.3Otherlong-termassets4,793.04,793.04,793.04,793.0Totalassets44,155.449,052.954,731.461,685.1Accountspayable7,348.18,475.29,834.611,095.6Short-termloans2,092.52,092.52,092.52,092.5Othercurrentliabilities3,590.53,590.53,590.53,590.5Totalcurrentliabilities13,031.114,158.215,517.616,778.6Long-termdebt8,992.28,992.28,992.28,992.2Otherlong-termliabilities1,561.71,561.71,561.71,561.7Totallong-termliabilities10,553.910,553.910,553.910,553.9Totalliabilities23,585.024,712.126,071.527,332.5Preferredshares--------Totalcommonequity19,986.523,581.927,657.333,030.7Minorityinterest584.0758.81,002.61,322.0Totalliabilities&equity44,155.449,052.954,731.461,685.1BVPS(Rmb)9.4311.1313.0515.59Ratios12/1712/18E12/19E12/20ECROCI(%)20.119.020.322.4ROE(%)17.017.018.120.0ROA(%)7.18.08.910.4Inventorydays58.668.870.569.1Receivablesdays126.6129.5130.8129.5Payabledays147.5151.2151.7149.0Netdebt/equity(%)23.615.29.30.1Interestcover-EBIT(X)8.110.412.717.9Valuation12/1712/18E12/19E12/20EP/Ebasic(X)15.713.711.08.4P/B(X)2.22.21.81.5EV/EBITDA(X)10.810.18.06.1EV/GCI(X)1.91.91.61.3Dividendyield(%)0.41.11.41.8Note:Lastactualyearmayincludereportedandestimateddata.Source:Companydata,GoldmanSachsResearchestimates.资料来源:Companydata,GaoHuaSecuritiesResearch
Leveragingsynergybetweenlow-voltagepowerequipmentandsolartechtodriveLCOE-orientedfull-cyclesolarsolutionIncorporatedin1997,ZhejiangChintisthelargestlow-voltageelectricalequipmentmakerinChinaandisactivelyexpandingitssolarpoweroperationandmanufacturingbusinesswith2.2GWsolarfarmsand2.2GWofsolarmodulecapacitybyend-2017.Leveragingitsstrongfranchiseandcash-flowgenerationinlow-voltageelectricalequipment,ZhejiangChintaimstodriveafull-cyclesolarservicesolutioncoveringupstreamcell/module/invertermanufacturing,midstreamEPCserviceanddownstreamsolarfarmoperation.In2016,ZhejiangChintacquired85.4%ofChintNewEnergy,100%ofLeqingXiangru,100%ofLeqingZhantu,100%ofLeqingFengyuanand100%ofHangzhouTaikubyissuing562mnadditionalsharestoChintGroupandothershareholdersatRmb16.66(representingaconsiderationofRmb9.37bn),throughthistransaction,ZhejiangChintacquired99.44%ofChintNewEnergy(1.5GWofsolarfarmcapacityand700M/1.7GWsolarcell/modulecapacity).ChintalsoraisedRmb4.36bnbyissuing248mnadditionalsharesatRmb17.58/sharetofundfurthersolarfarmconstruction.图表68:ZhejiangChinthas2.2GWsolarfarmsbyend-2017Capacityandrevenueofsolarfarmoperation图表69:Solarbusinessaccountedfor40%oftotalrevenuein2017Historicalrevenuebreakdownbysegment2,5002,0001,800(MW)(Rmbmn)1,6001,40025,00020,000(Rmbmn)1,5001,2001,00015,0001,00050080060040020010,0005,000002015201620170201220132014201520162017CapacityRevenue(RHS)SolarmodulesSolarpowerSolarfarmEPCOthersLow-electricalequipment资料来源:Companydata资料来源:Companydata图表70:Historicalgrossmarginbysegment图表71:ZhejiangChintrecordedan18%netincomeCAGRin2012-17HistoricalnetincomeandEBITmargin70%60%50%40%30%20%10%3,0002,5002,0001,5001,00050025%(Rmbmn)20%15%10%5%0%20122013201420152016201700%201220132014201520162017SolarmodulesSolarfarmEPCLow-voltageelectricalequipmentSolarpowerNetincomeEBITmargin
研究中国资料来源:Companydata资料来源:Companydata
ActiveexpansionandoptimizationofprojectportfoliotodrivesolarEPCandoperationrevenueLeveragingitsstrongfranchiseandcash-flowgenerationinlow-voltageelectricalequipment,ZhejiangChintaimstodriveafull-cyclesolarservicesolutioncoveringupstreamcell/module/invertermanufacturing,midstreamEPCserviceanddownstreamsolarfarmoperation.WeexpectZhejiangChinttorecorda25%CAGRforsolarrevenuein2018-20,mainlydrivenbya45%CAGRforEPCserviceand19%forpowersales.Withproductioncapacitycoveringhigh-efficiencysolarcell/moduleandinverters,ZhejiangChinthasbuiltanaggregateof3.5GWsolarprojectsgloballyandoffersanLCOE-orientedfull-cycleEPCservicetodownstreaminvestors.Withastrongbalancesheetandglobalfranchisefromlow-voltageelectricalequipmentbusiness,webelieveZhejiangChintisbest-positionedtoridearisingsectorconcentrationasdownstreamsolarfarminvestorshavedisplayedanincreasingpreferenceforLCOE-orientedfull-cycleEPC/BTservicesprovidedbylarge-scaleleadingEPC/BTcompanies,inourview.WeexpectZhejiangChint,withmorethan2.8GWofpipelineonhandasofend-2017,todeliver230/350/500MWofEPCprojectsin2018-20,andrecorda45%revenueCAGRduringthisperiod.图表72:WeexpectEPCservicetodelivera45%revenueCAGRin2018-20EPCprojectvolumeandrevenueforecast图表73:ZhejiangChinthas2.89GWprojectpipelineatend-2017Installedprojectsatyear-endandprojectpipelineonhand8,0007,0006,0005,0004,0003,0002,0001,000600(Rmbmn)(MW)5004003002001003,500(MW)3,0002,5002,0001,5001,00050000201620172018E2019E2020ERevenueEPCproject0Projectsatyear-endPipeline20162017研究中国资料来源:Companydata,GaoHuaSecuritiesResearch资料来源:Companydata图表74:ConversionefficiencyofZhejiangChint’scellandinverter20162017Multicell18.60%20.10%Monocell20%21.40%Inverter98.50%98.50%资料来源:Companydata
GridconnectionTransformerSwithgearACcabinetTransformerDCcabinetCombinerboxSolarmodulesInverter图表75:ZhejiangChintoffersaLCOE-orientedfull-cycleEPCsolution研究中国资料来源:CompanydataZhejiangChintisalsoactivelyexpandingintheresidentialroof-topEPCbusiness.In2017,ZhejiangChintcompleted40,000residentialroof-topprojectsanddevelopedover60distributorsinZhejiangprovinceandover22distributorsinAnhui,HenanandShandongprovinces.Althoughtheresidentialroof-topbusinessofferssmallersingle-projectscale(usually3-5kwperproject),webelievetheresidentialroof-topmarketofferstremendousupsideinChinaonthebackof:1)theimprovingeconomicsofsolarpower;and2)adequateroof-topspaceinruralareaswithlowpenetrationsinChina.Asofend-2017,Chinahadaruralpopulationof577mnand645mnhaoffarminglandarea;weestimatethatthiscouldcreateinstallationsitesformorethan300GWofpotentialresidentialroof-topprojects(assuming100mnofruralhouseholdswith20m2ofroof-topareaeachcarrya3kwproject).Leveragingitsnationwidedistributionnetworkandstrongbrandequityfromthelow-electricalequipmentsegment,webelieveZhejiangChintiswell-positionedtorideontherisingruralresidentialroof-topmarketgoingforward.
图表76:Chinahadaruralpopulationof577mnasofend-2017Ruralpopulationandaveragemonthlyincome图表77:Chinahad645mnhaoffarmlandasofend-2017FarmlandareainChina6606406204,000(Rmbmn)(Rmb)3,5003,0002,500650(Mnhectare)6456406002,0006355805601,5001,0005006306255400201220132014201520162017RuralpopulationAveragemonthlyincome620201520162017201520162017资料来源:Companydata资料来源:CompanydataForthedownstreamoperationbusiness,ZhejiangChinthasbeencontinuouslyoptimizingitsprojectportfoliotodriveinvestmentreturns.TheportionofcapacityfromDGhasgrownfrom20%in1Q17to48%in3Q18.DGoffersbettercashflowgenerationandlesscurtailmentriskscomparedtoutility-scaleprojects,inourview.WeexpectZhejiangChinttoadd200/350/400MWofnewcapacityin2018-20andrecorda19%revenueCAGRfrompowersales.Weexpectgrossmargintoexpandfrom64.9%in2018to70.1%in2020thankstocontinuedportfoliooptimization.图表78:TheportionofDGoftotalcapacitygrewfrom20%in1Q17to48%in3Q18Solarfarmcapacitybreakdown(MW)2,5002,0001,500图表79:WeexpectZhejiangChinttoadd200/350/400MWin2018-20Accumulativecapacityandnewadditionofsolarprojects(MW)3,5003,0002,5002,0001,0001,50050001Q172Q173Q174Q171Q182Q183Q18UtilityDG1,0005000201620172018E2019E2020EAccumulativecapacityNewaddition研究中国资料来源:Companydata资料来源:Companydata,GaoHuaSecuritiesResearch
图表80:Weexpectgrossmarginofpowersalestoexpandfrom64.9%to70.1%in2018-20Solarfarmoperationrevenueandgrossmarginforecast3,5003,0002,5002,0001,5001,00050080%(Rmbmn)70%60%50%40%30%20%10%研究中国00%201620172018E2019E2020ERevenueGrossmargin资料来源:Companydata,GaoHuaSecuritiesResearchForsolarmodulesales,weexpecttoseea15%revenuedeclinein2018duetoa15%ASPdrop,andweexpectrevenuegrowthrecoverto4%/15%in2019/20asChinademandrecovers.Grossmarginshoulddrop9pptto9%in2018onlowerASP,butweexpectittograduallyrecoverto10%/12%in2019/20.Low-voltagepowerequipmentre-gainingmomentumpostdistributionrestructureAsthelargestlow-voltagepowerequipmentmakerinChina,ZhejiangChintrecordedrevenueofRmb14bnin2017,withc.17%-18%marketshareonourestimate.Webelieveitscompetitiveadvantageliesin:1)Strongbrandequitythroughconsistentlyrollingouthigh-qualityproductsandthewidestproductofferingsacrossthevaluechain;2)avastandhighlyefficientdistributionnetwork(400coredistributorsand2,800distributionoutletsby2017);and3)itsCIP(ContinuedImprovementinProcess)initiativetooptimizecoststructureandimproveproductivity.
研究中国图表81:Salesvolumeoflow-voltageelectricalequipment(Mnunit)1,4001,2001,00080060040020002015201620172018E2019E2020EPowerDistributionEquipmentTerminalDevicePowerControlEquipmentPowerSupplyEquipmentPowerElectronicsInstrumentsandMetersBuildingElectricalAppliances资料来源:Companydata,GaoHuaSecuritiesResearchZhejiangChint’slow-voltagepowerequipmentsalessawrapidgrowthin2011-13witha24%CAGR.Revenuegrowthslowedto7%in2014and-7%in2015onahighcomparablebaseandaweakmacrobackground.Inlate2015,ZhejiangChintstartedtorestructureitsdistributionnetworkby:1.Introducingatwo-layerdistributionnetwork;thenumberofcoredistributorsincreased33%yoyto400in2017.2.Optimizingtheincentivesystemfordistributors.ZhejiangChintstartedshareholdingschemeforselecteddistributorsinJanuary2018(ChintGroupsold24.18mnsharesofZhejiangChinttoGuotai-Gubenassetmanagementplanat22.47rmb/shareinconnectionwithashareholdingschemeforselectdistributorsandemployees).In2016,ZhejiangChintrolledoutanupgraded“Kunlun”brand.WithoverRmb150mnofinvestmentinR&D,360patentsand7,860reliabilitytests,“Kunlun”offersahigher-qualityversionofitsexistingproductline.
图表82:Numberofdistributorsup33%in2017Numberofdistributors图表83:ASPofallproductsexceptformetersrecoveredin2017ASPoflow-voltagepowerproducts4504003503002502001501005003,0002,5002,0001,5001,00050001009080706050403020100(Rmb/unit)201520162017201220132014201520162017NoofcoredistributorsNoofdistributionoutletPowerDistributionEquipmentTerminalDevicePowerControlEquipmentPowerSupplyEquipmentInstrumentsandMetersBuildingElectricalAppliances资料来源:Companydata资料来源:Companydata图表84:ASPofallproductsexceptformetersrecoveredin2017ASPchangeoflow-voltagepowerproducts20172016-70%-60%-50%-40%-30%-20%-10%0%10%20%30%BuildingElectricalAppliancesInstrumentsandMetersPowerElectronicsPowerSupplyEquipmentPowerControlEquipmentTerminalDevicePowerDistributionEquipment研究中国资料来源:CompanydataThankstotheaboveinitiatives,segmentsalesgrowthrecoveredto14%in2017,andZhejiangChintraisedASPoflow-voltagepowerproductsby3%-5%in1Q18.WeexpectZhejiangChint’sre-vitalizeddistributionsystemandstrongbrandequitytodrivea13%revenueCAGRforlow-voltagepowerproductsandgrossmargincouldexpandfrom33.6%in2018to35.6%in2020.
图表85:Weexpectlow-voltagepowerproducttodelivera13%revenueCAGRin2018-20Low-voltageproductrevenueandoverallYoYgrowthforecast图表86:Weexpectgrossmarginoflow-voltagepowerproductstoexpandfrom33.6%in2018to35.6%in2020Grossmarginoflow-voltagepowerproducts25,00020,00015,00010,0005,0000201620172018E2019E2020E20%(Rmbmn)18%16%14%12%10%8%6%4%2%0%45%43%41%39%37%35%33%31%29%27%25%201620172018E2019E2020EPowerDistributionEquipmentTerminalDevicePowerControlEquipmentPowerSupplyEquipmentPowerElectronicsInstrumentsandMetersPowerDistributionEquipmentTerminalDevicePowerControlEquipmentPowerSupplyEquipmentPowerElectronicsInstrumentsandMeters研究中国BlendedBuildingElectricalAppliancesControlSystemoverallYoYgrowth(RHS)BuildingElectricalAppliancesControlSystem资料来源:Companydata,GaoHuaSecuritiesResearch资料来源:Companydata,GaoHuaSecuritiesResearchFinancialstatementanalysisP&L:WeexpectZhejiangChinttorecorda17%revenueCAGRin2018-20E,ona13%revenueCAGRfromthelow-voltageequipmentsegmentanda25%revenueCAGRfromthesolarsegment.Weexpectgrossmargintograduallyexpandto29.8%/30.9%/31.5%duetohigherlow-voltageequipmentASPandrisingutilizationinsolarfarmoperation.WeexpectChinttorecord16.2%/17.3%/19.1%EBITmarginin2018-20EandnetincomeofRmb3.7/4.6/6.1bn.Balancesheet:Chint’snetgearingwas24%anditscashbalancewasRmb7.4bnbyend-2017.Weexpectnetgearingtobe15%/9%/0%duetomoderatecapex.Cashflow:WeforecastChinttorecordcapexofRmb2.6/3.3/3.5bnin2018-20,mainlytosupporttheconstructionofsolarfarms.Weexpectthecompany’snetcashflowtobeRmb1.17/1.01/2.64bnin2018-20.
研究中国图表87:Keyassumptions201620172018E2019E2020ESolarfarmCapacity(MW)1,4602,1752,3752,7253,125Revenue(Rmbmn)1,1111,7022,2582,7973,191Grossmargin53%59%65%69%70%SolarEPCProjectVol(MW)46115.37230350500Revenue(Rmbmn)1,6041,8243,3154,9007,000Grossmargin20%17%18%18%19%SolarmoduleShipment(MW)1,3522,0432,0432,2472,697ASP(Rmb/W)3.52.62.22.12.0Revenue(Rmbmn)4,7295,2684,4784,6805,391Grossmargin18%17%9%10%12%Low-voltagepowerequipmentRevenue(Rmbmn)12,32114,07316,51518,75921,001Grossmargin33%32%34%35%36%Totalrevenue(Rmbnmn)20,16523,41727,19831,86237,418YoYgrowth16%16%16%17%17%Grossmargin30%29%30%31%31%EBITmargin16%15%16%17%19%资料来源:Companydata,GaoHuaSecuritiesResearchSolidgrowthoutlookandundemandingvaluation;initiateatBuyWeexpectZhejiangChinttodelivera28%netincomeCAGRin2018-20.ZhejiangChint’ssharesaretradingat2019EV/EBITDAof8.0x(vs.thecompany’spastfive-yearaverageof10.6xandmedianof9.7x).Itscomparablepeershadafive-yearaverageEV/EBITDAof10.5x.Webelievethevaluationofitspeergrouptobehighlyco-relatedtoEBITDAgrowth.Asthecompanyhasasector-leadinggrowthoutlook,weexpectthesharestotradeuptotheaverageofcomparablepeers.Webaseour12-monthtargetpriceofRmb32.3onatarget2019EV/EBITDAof10.5x(inlinewiththefive-yearhistoricalaverageofZhejiangChint’speergroup).With38%upsidetoourtargetprice,andconsideringourpositiveviewonthecompany’sprospects,weinitiatecoverageatBuy.
图表88:CurrentEV/EBITDAvs.peers图表89:HistoricalEV/EBITDA+1std:13.1x-1std:8.0xAve:10.6x1230%20.01025%820%18.016.014.0615%410%12.010.08.025%00%Chint-currentPeergroupChint-historical6.04.02.02018EV/EBITDA2019EV/EBITDA18-20EEBITDAcagr(RHS)0.01/1/20131/1/20141/1/20151/1/20161/1/20171/1/2018资料来源:Wind,Bloomberg,GaoHuaSecuritiesResearch资料来源:Wind,GaoHuaSecuritiesResearch图表90:HistoricalEV/EBITDAvs.EBITDACAGR1614121086420100%90%80%70%60%50%40%30%20%10%0%LongiGCLNewenergyChintTongweiCSIQ研究中国AverageMedian13-17EBITDAcagr(RHS)资料来源:Wind,GaoHuaSecuritiesResearchKeyrisk:Slower-than-expectednewprojectconstruction.WeexpectZhejiangChinttoadd200/350/400MWofnewcapacityin2018-20andrecordan18%revenueCAGRfrompowersales.Slower-than-expectednewprojectconstructionwouldposedownsideriskstoourestimates.Lower-than-expectedASPforEPCprojects.Lower-than-expectedASPforEPCprojectswoulddragonthecompany’sgrossmarginandposedownsiderisktoourestimates.
研究中国Tongwei(600438.SS):Emergingpolygiant;initiateatBuyTongweiisthethirdlargestanimalfeedandfourthlargestpolysiliconmakerinChina,withitssolarandagriculturesegmentscontributing55%and45%ofgrossprofitrespectivelyin2017.WebelieveTongwei’scompetitiveadvantageliesinits:1)leadingpurificationtechnologyandsolidexecutiontodrivetherapidexpansionoflow-costpolysiliconcapacity;2)ecological“FisheriesandPV(Photovoltaic)integration”modeltodrivesynergybetweenitsfranchiseinaquaculturefeedandsolidknow-howonsolarpoweroperation.Overall,weexpectTongweitodelivera46%netincomeCAGRover2018-20.Leadingpurificationtechnologytodriverapidexpansionoflow-costpolycapacity:Tongwei’sproductioncostofpolysiliconisc.15-20%lowerthanthesectoraverageonthebackofitsmoreadvancedpurificationtechnologyandfavorablelocalenergycosts.WeexpectTongweitoadd50,000tonsincapacityover2018-20andrecord100%salevolumeCAGRand83%revenueCAGR.In2018,weforecastASPtodrop25%duetolowerChinademandin2H18andgrossmargintodeclineby12.1pptto29.1%.However,weexpectgrossmarginforpolysiliconsalesrecoverto29.9%/31.4%in2019/20ascostreductioncatchesupwithASPdecline.EcologicalfisheryandPVintegrationmodeltoleveragefranchisefromaquaculturebusiness:Withauniquefishery-and-PVintegratedmodel,Tongweihasbeenabletoleverageitsbrandequityfromtheaquaculturefeedbusinessandin-depthknow-howonsolarpowertocreatesynergybetweenthetwosegments.WeexpectTongweitoadd513/100/100MWinsolarprojectsin2018-20,whichcoulddrivea33%revenueCAGRforpowersales,andseegrossmarginforitspowersalesexpandingto45.9%/63.4%/64.1%asutilizationrampsup.Keycatalysts:Recoveryinpolysiliconprices,faster-than-expectedcapacityconstruction.Undemandingvaluation:Tongweiistradingat7.5x2019EV/EBITDAvs.itspast5-yearaverageandmedianof9.4xand8.7xrespectively,and10.2x5-yearaverageEV/EBITDAforitspeers.Giventhepositiveoutlookandundemandingvaluation,andwitha42%upsidetoour12-monthtargetpriceofRmb12.3,weinitiatecoverageonTongweiwithaBuyrating.
研究中国图表91:FinancialsummaryProfitmodel(Rmbmn)12/1712/18E12/19E12/20ETotalrevenue26,089.232,183.440,932.345,979.5Costofgoodssold(21,023.5)(26,881.5)(33,306.9)(36,703.4)SG&A(2,380.9)(2,896.5)(3,683.9)(4,138.2)R&D--------Otheroperatingprofit/(expense)(104.2)(93.8)(98.5)(103.4)EBITDA3,542.03,482.05,092.26,334.8Depreciation&amortization(961.5)(1,170.5)(1,249.1)(1,300.3)EBIT2,580.52,311.53,843.05,034.5Interestincome31.027.425.239.9Interestexpense(148.1)(270.1)(339.4)(394.6)Income/(loss)fromuncons.subs.--------Others(21.1)170.0100.080.0Pretaxprofits2,442.42,238.83,628.84,759.8Incometax(400.9)(335.8)(544.3)(714.0)Minorities(29.4)(15.2)(37.0)(48.6)Netincomepre-preferred2,012.01,887.83,047.53,997.3Preferreddividends--------Netincome(pre-exceptionals)2,012.01,887.83,047.53,997.3Posttaxexceptionals--------Netincome2,012.01,887.83,047.53,997.3EPS(basic,pre-except)(Rmb)0.520.490.781.03EPS(basic,post-except)(Rmb)0.520.490.781.03EPS(diluted,post-except)(Rmb)0.520.490.781.03DPS(Rmb)0.030.070.120.15Dividendpayoutratio(%)5.815.015.015.0Freecashflowyield(%)(4.7)(5.2)1.86.4Growth&margins(%)12/1712/18E12/19E12/20ESalesgrowth24.923.427.212.3EBITDAgrowth67.3(1.7)46.224.4EBITgrowth97.0(10.4)66.331.0Netincomegrowth96.3(6.2)61.431.2EPSgrowth96.3(6.2)61.431.2Grossmargin19.416.518.620.2EBITDAmargin13.610.812.413.8EBITmargin9.97.29.410.9Cashflowstatement(Rmbmn)12/1712/18E12/19E12/20ENetincomepre-preferreddividends2,012.01,887.83,047.53,997.3D&Aadd-back961.51,170.51,249.11,300.3Minoritiesinterestsadd-back29.415.237.048.6Net(inc)/decworkingcapital(35.7)(206.8)(513.3)(491.7)Otheroperatingcashflow(51.3)------Cashflowfromoperations2,915.82,866.83,820.44,854.4Capitalexpenditures(4,328.4)(4,647.5)(3,200.0)(2,650.0)Acquisitions--------Divestitures--------Others340.7------Cashflowfrominvestments(3,987.7)(4,647.5)(3,200.0)(2,650.0)Dividendspaid(common&pref)(642.8)(115.9)(283.2)(457.1)Inc/(dec)indebt1,968.11,700.01,000.01,000.0Commonstockissuance(repurchase)52.5------Otherfinancingcashflows(1,147.0)------Cashflowfromfinancing230.91,584.1716.8542.9Totalcashflow(841.0)(196.6)1,337.22,747.3Balancesheet(Rmbmn)12/1712/18E12/19E12/20ECash&equivalents2,489.42,292.83,630.06,377.3Accountsreceivable1,390.51,763.52,467.22,897.3Inventory1,767.72,356.73,011.33,519.5Othercurrentassets1,736.21,736.21,736.21,736.2Totalcurrentassets7,383.78,149.210,844.714,530.4NetPP&E12,185.015,690.317,669.519,047.4Netintangibles1,233.51,205.21,177.01,148.7Totalinvestments248.0248.0248.0248.0Otherlong-termassets4,498.24,498.24,498.24,498.2Totalassets25,548.529,790.934,437.339,472.7Accountspayable2,779.83,535.14,380.14,826.7Short-termloans4,013.04,813.05,313.05,813.0Othercurrentliabilities2,503.82,503.82,503.82,503.8Totalcurrentliabilities9,296.510,851.812,196.813,143.5Long-termdebt1,008.41,908.42,408.42,908.4Otherlong-termliabilities1,538.61,538.61,538.61,538.6Totallong-termliabilities2,547.03,447.03,947.04,447.0Totalliabilities11,843.514,298.816,143.817,590.4Preferredshares--------Totalcommonequity13,339.415,111.317,875.621,415.8Minorityinterest365.6380.9417.9466.4Totalliabilities&equity25,548.529,790.934,437.339,472.7BVPS(Rmb)3.443.894.605.52Ratios12/1712/18E12/19E12/20ECROCI(%)19.315.918.519.9ROE(%)16.113.318.520.3ROA(%)8.66.89.510.8Inventorydays27.328.029.432.5Receivablesdays17.717.918.921.3Payabledays44.242.943.445.8Netdebt/equity(%)18.528.622.410.7Interestcover-EBIT(X)22.09.512.214.2Valuation12/1712/18E12/19E12/20EP/Ebasic(X)14.817.911.18.4P/B(X)2.22.21.91.6EV/EBITDA(X)9.211.17.55.8EV/GCI(X)1.81.71.41.2Dividendyield(%)0.40.81.41.8Note:Lastactualyearmayincludereportedandestimateddata.Source:Companydata,GoldmanSachsResearchestimates.资料来源:Companydata,GaoHuaSecuritiesResearch
LeadingpolysiliconmakerinChinaListedin2004,Tongweiisaleadinganimalfeedmakerwithc.20%shareinChinaaquaculturefeedmarketasofend-2017.ItsparentcompanyTongweiGroupstartedsolarpolysiliconmanufacturingin2006,andTongweiacquiredSichuanYongxiangandHefeiTongweifromTongweiGroupin2015and2016respectively,tobecomeChina’sfourthlargestpolysiliconmakerandthirdlargestsolarcellmakerbycapacityasofend-2017.Tongweihas20,000tonsofpolysiliconand5.4GWofsolarcellcapacitybyend-2017andisfurtherlookingtoadd50,000tonspolysiliconand5GWincellcapacityover2018-20.In2017,itssolarandaquaculturebusinessesaccountedfor55%and45%ofgrossprofitrespectively.WebelieveTongwei’scompetitiveadvantageliesinits:1)leadingpurificationtechnologyandsolidexecutiontodrivetherapidexpansionoflow-costpolysiliconcapacity;2)ecological“FisheriesandPVintegration”modeltodrivesynergybetweenitsfranchiseinaquaculturefeedandsolidknow-howonsolarpoweroperation.图表92:Tongweihas20,000tonsinpolycapacitybyend-2017Polysiliconcapacityandsalesvolume图表93:Tongweihas2.4GWinmulticapacityand3GWinmonocellcapacitybyend-2017Solarcellcapacityandsalesvolume90,00080,00070,00060,00050,00040,00030,00020,00010,00014,000(MW)12,00010,0008,0006,0004,0002,000(Ton)02015201620172018E2019E2020ECapacitySalesvol02015201620172018E2019E2020EMulticellcapacityMonocellcapacitySalesvol资料来源:Companydata,GaoHuaSecuritiesResearch资料来源:Companydata,GaoHuaSecuritiesResearch图表94:Thesolarbusinessaccountedfor40%of2017salesand55%ofgrossprofitRevenuesbysegmentandgrossmarginsoffeedandpolysiliconbusinesses图表95:Tongweirecorded84%netprofitCAGRover2012-17NetincomeandEBITmargin50,00045,00040,00035,00030,00025,00020,00015,00010,0005,0000(Rmbmn)2015201620172018E2019E2020E60%50%40%30%20%10%0%4,5004,0003,5003,0002,5002,0001,5001,000500012%(Rmbmn)10%8%6%4%2%0%FeedprocessingFoodprocessingAnimalhealthcareCultivationandothersPolysiliconandrelatedSolarfarmoperationSolarcellGrossmarginoffeed(RHS)Grossmarginofpoly(RHS)
2015201620172018E2019E2020ENetincomeEBITmargin研究中国资料来源:Companydata,GaoHuaSecuritiesResearch资料来源:Companydata,GaoHuaSecuritiesResearch
Leadingpurificationtechnologytodriverapidexpansionoflow-costpolycapacityWeestimateTongwei’sproductioncostofpolysiliconisc.15-20%lowerthanthesectoraverageonthebackofitsmoreadvancedpurificationtechnologyandfavorablelocalenergycosts.Thecompanycompletedtheconstructionof25,000tonsofnewcapacityinBaotouinSeptember2018,andislookingtoaddanother25,000tonsofcapacityinLeshaninlate2018orearly2019.Withitssector-leadingcostadvantage,weexpectTongweitofurtherdrivemarketshareandrevenuegrowththroughrapidcapacityexpansion.图表96:Tongweireduceditsunitpowerconsumptionto62kwh/kgbyend-2017Productioncostandunitpowerconsumptionofpolysiliconsegment图表97:Energycostaccountedfor37%oftotalproductioncostin2017Costbreakdownofpolysilicon(2017)(Rmb/kg)(kwh/kg)708568756664656255605845563554RawmaterialLaborDepreciationEnergyProductionandothers研究中国5225201520162017ProductioncostUnitpowerconsumption(RHS)Sectoraverage(RHS)资料来源:Companydata,CPIA资料来源:CompanydataIn2017,energycostaccountedfor37%ofTongwei’sproductioncostandisthelargestcostcomponent.Tongweiupgradeditspolysiliconcapacityin2013andhassincebeenimprovingtheefficiencyofitshydrogenationprocesstorecyclesilicontetra-chloridetodrivethereductionofunitpowerconsumption(energycosts).Over2015-17,Tongweireduceditsunitpowerconsumptionfrom70kwh/kg(vs.sectoraverageof80kwh/kg)to62kwh/kg(vs.sectoraverageof75kwh/kg),anditstotalproductioncostfromRmb68.7/kgtoRmb58.8/kg.Weexpecttotalcapacitycouldreach70,000tonsbyend-2019.Thecompanyhasguidedthatover70%ofnewcapacitycouldproducehigh-qualitypolysiliconformonowafersandnewcapacitycouldbeoperatedwithc.Rmb40/kgproductioncost.WeexpectTongwei’srapidexpansionoflow-costcapacitytohelpdrivemarketsharegainsinChina,andthecompanytorecord100%salesvolumeCAGRand83%revenueCAGRover2018-20.In2018,weexpectASPtodrop25%duetolowerChinademandin2H18andgrossmarginsshoulddeclineby12.1pptto29%.Weexpectgrossmarginrecoverto29.9%/31.4%in2019/20ascostreductioncatchesupwithlowerASP.
图表98:WeexpectTongwei’spoly-siliconcapacitytoreach70ktonsbyend-2020Poly-siliconcapacityandsalesvolumeforecast图表99:WeexpectTongweitorecord83%revenueCAGRover2018-20Poly-siliconrevenueandgrossmarginforecast90,00080,00070,00012,00010,00045%(Rmbmn)40%35%60,0008,00030%50,00040,0006,00025%20%30,0004,00015%20,00010,0002,00010%5%(Ton)0201620172018E2019E2020ECapacitySalesvol00%201620172018E2019E2020ERevenueGrossmargin资料来源:Companydata,GaoHuaSecuritiesResearch资料来源:Companydata,GaoHuaSecuritiesResearchTosupportthecapacityexpansion,Tongweiestimatesthecapexrequiredtobec.Rmb6.4bnandproposedonDecember15,2017toissuenomorethanRmb5bnconvertiblebonds(CB)tofunditscapexplan.Accordingtotheproposal,theinitialconversionpriceshouldbenolowerthanthe20-dayaveragepriortothepublicationdateofitsCBprospectusandtheinterestratewouldbedeterminedbasedonmarketconditionspriortoissuance.Ifcompleted,thiswoulddilutecurrenttotalnumberofordinarysharesby15%(assumingaconversionpricetobethelastclosingpriceofDecember17,2018).Wedonotfactorthisintoourestimatespendingcompletion.图表100:Historicalandforecastcapexandcashflow(Rmbmn)2016202018E2019E2020E176,00010,0005,0009,0004,0008,0007,0003,0006,0002,0005,0001,0004,0003,000-2,000(1,000)1,000(2,000)-OperatingcashflowNetcashflowCAPEX(RHS)Cashbalance(RHS)研究中国资料来源:Companydata,GaoHuaSecuritiesResearchOntopofthe5.4GWinsolarcellcapacityasofend-2017,Tongweiadded3.2GWinitsChengdufactoryinNovember2018andtargets2.3GWinitsHefeifactoryin2019.Weestimatethe5.5GWinnewcapacitywouldrequire
Rmb3.3bncapex,andnotedthat
TongweihassecuredRmb3bnfundingthroughtheissuanceof498mnsharesatRmb6.02persharein2017.Tongweirecordedsalesvolumeof66%yoyin1H18andhasmanagedtoloweritsnon-siliconprocessingcosttoRmb0.2-0.3/w.Onthebackofitsconsistentroll-outofhigh-efficiencyandhighcost-performanceproducts,weexpectsolarcellstosee22%salesvolumeCAGRand15%revenueCAGRover2018-20.Weexpectgrossmarginstodeclineby6pptto13%in2018ona17%ASPdeclineduetolowerChinademandin2H18.Over2019-20,weexpectASPdeclinetonarrowto6%p.a.asdemandrecovers,butgrossmarginscouldrecoverto12.6/13.5%asitscostreductioneffortscatchupwiththeASPdecline.图表101:WeexpectTongweitorecord15%solarcellsalesCAGRover2018-20Solarcellcapacityandsalesvolumeforecasts图表102:Weexpectthesolarcellsegmenttosee15%revenueCAGRover2018-20Solarcellrevenueandgrossmarginforecasts14,00012,00010,0008,0006,0004,0002,00016,00014,00012,00010,0008,0006,0004,0002,00025%(Rmbmn)20%15%10%5%(MW)0201620172018E2019E2020EMulticellcapacityMonocellcapacitySalesvol00%201620172018E2019E2020ERevenueGrossmargin(RHS)研究中国资料来源:Companydata,GaoHuaSecuritiesResearch资料来源:Companydata,GaoHuaSecuritiesResearchEcologicalfisheryandPVintegrationmodeltoleveragefranchisefromagriculturebusinessWithauniquefishery-and-PVintegratedmodel,Tongweihasbeenabletoleverageitsbrandequityfromtheagriculturefeedbusinessandin-depthknow-howonsolarpowertocreatesynergybetweenitssolarandagriculturebusinesses.Tongweirentsfisherypondsfromitsfishingfeedclients,renovatestheponds,andbuildsDG(distributedgeneration)solarfarmsabovetheponds.Oncethesolarfarmiscompleted,notonlydoesTongweigenerateprofitsfromsolarpowersalesbutitalsogainsfromsellingfisheryfeedtopondoperators.Withtheextrarentalincome,thismodelhasproventobeattractivetofisheryfarmers.Lastly,Tongweialsohaseasieraccesstohigh-qualitysitesforsolarfarmsandisabletofurtherstrengthenitspartnershipwithfeedcustomers.
SellfishingproductsSellfisheryfeedandprovidefisherytrainingRentfisherypondSellpowertoGridBuildandoperatePVfacilityConsumerFisheriesFisherypondrenovationTongweiFisheryownerGridPVoperation图表103:Tongwei’sFishery&PVintegrationmodel资料来源:CompanydataAsanexample,theTianjinBaodi20MWfishery-and-solarprogramconsistsof403,986squaremetersoffisherypondsandrequiredaninitialcapexatRmb181.89mn(Rmb173.3mnforsolarfarmconstruction,Rmb4.55mnforpondrenovationandRmb4.04mnforworkingcapital)tosetup.WithatariffofRmb0.95/kwh,weestimatetheprojecttogenerate30.91Gwhpowerp.a.withanIRRof11.64%.图表104:TianjinBaodi20MWfishery-and-solarprogramSolarfarmPondrenovationWorkingcapitalTotalInitialinvestment(Rmbmn)173.34.554.04181.89Revenue(Rmbmn)Operatingprofit(Rmbmn)Productionvolume(Gwh/ton)ProjectoutputPower30.9125.1Fisheryproducts1,19312.6912.671.64Total37.7914.31研究中国资料来源:CompanydataWeexpectTongweitoadd513/100/100MWinsolarprojectsin2018-20,whichcoulddrivea33%revenueCAGRforpowersales,andseegrossmarginexpandingto45.9%/63.4%/64.1%asutilizationrampsup..
图表105:WeexpectTongweitoadd513/100/100MWinsolarprojectsover2018-20Accumulativecapacityofsolaroperationandpoweroutputforecasts图表106:Weexpectsolarfarmoperationtorecord33%revenueCAGRover2018-20Revenueandgrossmarginforecastsforsolarfarmoperation1,4001,2001,000800600400200600,000(MW)(MWh)500,000400,000300,000200,000100,0002,5002,0001,5001,00050070%(Rmbmn)60%50%40%30%20%10%00201620172018E2019E2020EAcccapacityPoweroutput(RHS)00%201620172018E2019E2020ERevenueGrossmargin研究中国资料来源:Companydata,GaoHuaSecuritiesResearch资料来源:Companydata,GaoHuaSecuritiesResearchFinancialstatementanalysisP&L:WeexpectTongweitorecord20%revenueCAGRover2018-20,mainlydrivenby83%CAGRinpolysiliconsalesand33%CAGRinsolarpowersales.Weexpectgrossmarginstoseea3pptdeclineto16.5%in2018mainlyduetothe25%and17%declineinpolysiliconandsolarcellsASP.However,weexpect2019/20grossmarginstobe18.6%/20.2%ascost-reductioneffortscatchupwithlowerASP.Weexpect2018/19/20EBITmarginstobe7.2%/9.4%/10.9%,andnetincomeatRmb1.89bn/Rmb3.05bn/Rmb4.0bn.BalanceSheet:Tongwei’snetgearingwas18%byend-2017.Weexpectnetgearingtoincreaseto29%in2018duetohigherdebttosupportcapacityexpansionandfallto22%/11%asutilizationofnewcapacityrampsupover2019/20.CashFlow:WeforecastRmb4.7bn/Rmb3.2bn/Rmb2.7bncapexover2018/19/20,mainlytosupporttheconstructionofpolysiliconandsolarcellcapacity.Weexpectthecompany’snetcashflowtobe-Rmb197mn/Rmb1.3bn/Rmb2.7bnover2018/19/20.
图表107:Keyassumptions201620172018E2019E2020EPolysiliconSalesvolume(ton)12,11816,02620,00050,00080,000Revenue(Rmbmn)2,0633,2283,0416,84310,183Grossmargin34%41%29%30%31%SolarcellSalesvolume(ton)2,4243,9968,00011,00012,000Revenue(Rmbmn)3,7656,43310,68913,81614,168Grossmargin20%19%13%13%13%SolarfarmoperationCapacity(MW)89487100011001200Revenue(Rmbmn)907931,1281,8171,992Grossmargin38%29%46%63%64%AgriRevenue(Rmbmn)14798.88616219.7617324.6918456.119636.58Grossmargin12%14%14%15%15%Totalrevenue(Rmbmn)20,88426,08932,18340,93245,979YoYgrowth11%25%23%27%12%Grossmargin16%19%16%19%20%EBITmargin6%10%7%9%11%资料来源:Companydata,GaoHuaSecuritiesResearchUndemandingvaluationTongweiiscurrentlytradingat7.5x2019EV/EBITDAvs.itspast5-yearaverageandmedianof9.4xand8.7xand10.2x5-yearaverageEV/EBITDAforitspeers.Withitssector-leadinggrowthoutlook,weexpectthesharestotradehighertowardstheaverageofitscomparablepeersgroup.Assuch,weapplyatarget2019EV/EBITDAmultipleof10.2x(inlinewiththe5-yearhistoricalaverageofitspeergroup)toderiveour12-monthtargetpriceofHKD12.3.图表108:CurrentEV/EBITDAvs.peers图表109:HistoricalEV/EBITDA+1Std:11.8xAve:9.4x-1Std:7.0x1240%18.035%1030%825%16.014.012.0620%10.015%410%25%8.06.04.000%Tongwei-currentPeergroupTongwei-historical2.0研究中国1/1/20131/1/20141/1/20151/1/20161/1/20171/1/20182018EV/EBITDA2019EV/EBITDA18-20EEBITDAgrowth(RHS)0.0资料来源:Wind,GaoHuaSecuritiesResearch资料来源:Wind,GaoHuaSecuritiesResearch
研究中国图表110:HistoricalEV/EBITDAvs.EBITDACAGR14160%12140%10120%100%880%660%440%220%00%DaqoTBEATongweiGCLCSIQAverageMedian13-17EBITDAcagr(RHS)资料来源:Wind,GaoHuaSecuritiesResearchKeydownsiderisksSlower-than-expectedcapacityexpansion.WeexpectTongweitoadd50,000tonsincapacityover2018-20,butaslower-than-expectedcapacityexpansionwouldposedownsideriskstoourestimates.Lower-than-expectedpolyprices.WeexpectpolyASPtodecline10%and7%in2019/20.Ifpolypricesdeclinedmorethanexpected,therewillbedownsideriskstoourrevenueandgrossmarginforecasts.Slower-than-expectedsolarfarmconstruction.WeexpectTongweitoadd513/100/100MWofsolarfarmprojectsover2018-20.Slower-than-expectedsolarfarmconstructionwoulddragTongwei’srevenuefrompowersales.
研究中国Goldwind(2208.HK/002202.SZ):Leadingturbinemaker;initiateH-shareatBuyAsthelargestturbinemakerinChina,Goldwindhasshippedmorethan44GWinwindturbinesgloballywitha29%marketshareinChinaand11%globallyin2017.WebelieveGoldwind’scompetitiveadvantageliesinitssector-leadingturbinesystemdesignandcost-controlcapability,resultinginitshigh-efficiencyandlow-costproductoffering.WelikeGoldwind’sleadingpositionandmarketsharegainsthroughactiveexpansioninoffshoreandoverseasmarketsandforecast24%netincomeCAGRforGoldwindover2018-20.“OffshoreandOverseas”strategytodrivemarketshareexpansion:Managementhasidentifiedoffshoreandoverseasmarketsasthenextdriverformarketsharegainsandhasbeenactivelyfocusingonits“offshoreandoverseas”strategy.Asof3Q18,Goldwind’sturbineorderbacklogreachedahistoricalhighof18.2GW,amongwhichoffshoreprojectsandoverseasmarketscomprise1.38GWand737MW,representing8%and4%oftotalorderbacklogrespectively.WeexpectGoldwind’ssolidorderbacklogtosupportitswindturbinebusinesstorecord15%volumeCAGRand19%revenueCAGRover2018-20.Developingwindfarmsoverseastoestablishitsglobalfranchise:Inordertofurtherestablishitsglobalfranchise,Goldwindisactivelyexploringwindfarmdevelopmentoverseas.Asof3Q18,Goldwindhasc.3.2GWinwindprojectsunderconstruction,1.4GWor39%ofwhichareoverseasprojects.WeexpectGoldwindtobuild600/500/500windfarmsanddispose250MWinwindfarmprojectseachyeartopromoteoverseasturbinesalesover2018-20.WebelievethiscouldhelpGoldwindestablishitsbrandequityintargetedoverseasmarketsandexpanditsglobalmarketshare.Keycatalysts:Higher-than-expected2018results,better-than-expectedoverseassales.UndemandingvaluationfortheH-share:GoldwindA/Histradingat11.4x/8.5x2019EV/EBITDA;theH-shareistradinglowerthanthehistoricalaverageofcomparablepeerswhiletheA-shareishigherthanthehistoricalaverageofpeers.Hence,weinitiatecoverageofGoldwindHandAsharesatBuyandNeutralwith12-monthtargetpricesofHKD10.4andRmb12.7respectively,implying37%and18%upsidepotentialvs.27%averageupsideforourwindcoverage.
研究中国图表111:FinancialsummaryProfitmodel(Rmbmn)12/1712/18E12/19E12/20ETotalrevenue24,970.831,103.436,426.144,489.7Costofgoodssold(16,381.0)(21,105.7)(24,384.2)(29,727.3)SG&A(4,621.5)(5,443.1)(6,192.4)(7,340.8)R&D--------Otheroperatingprofit/(expense)(377.2)(469.9)(510.0)(578.4)EBITDA3,591.14,084.75,339.56,843.3Depreciation&amortization(1,124.1)(1,288.4)(1,441.7)(1,653.7)EBIT2,467.02,796.43,897.85,189.6Interestincome75.067.364.873.3Interestexpense(817.8)(944.9)(1,131.1)(1,266.1)Income/(loss)fromuncons.subs.65.467.667.667.6Others1,700.91,890.41,920.41,920.4Pretaxprofits3,490.63,876.84,819.65,984.9Incometax(341.7)(389.3)(493.0)(621.2)Minorities(94.2)(101.6)(128.6)(162.1)Netincomepre-preferred3,054.73,385.94,198.05,201.6Preferreddividends--------Netincome(pre-exceptionals)3,054.73,385.94,198.05,201.6Posttaxexceptionals--------Netincome3,054.73,385.94,198.05,201.6EPS(basic,pre-except)(Rmb)0.860.951.181.46EPS(basic,post-except)(Rmb)0.860.951.181.46EPS(diluted,post-except)(Rmb)0.860.951.181.46DPS(Rmb)0.200.240.300.37Dividendpayoutratio(%)23.325.025.025.0Freecashflowyield(%)(6.0)(8.2)(2.7)1.9Growth&margins(%)12/1712/18E12/19E12/20ESalesgrowth(4.6)24.617.122.1EBITDAgrowth(7.6)13.730.728.2EBITgrowth(16.7)13.439.433.1Netincomegrowth1.710.824.023.9EPSgrowth1.710.824.023.9Grossmargin34.432.133.133.2EBITDAmargin14.413.114.715.4EBITmargin9.99.010.711.7Cashflowstatement(Rmbmn)12/1712/18E12/19E12/20ENetincomepre-preferreddividends3,054.73,385.94,198.05,201.6D&Aadd-back1,124.11,288.41,441.71,653.7Minoritiesinterestsadd-back94.2101.6128.6162.1Net(inc)/decworkingcapital(629.4)(2,437.0)(2,618.7)(2,742.0)Otheroperatingcashflow(620.0)(197.5)(171.4)(109.8)Cashflowfromoperations3,023.52,141.42,978.24,165.6Capitalexpenditures(4,842.7)(4,217.5)(3,681.3)(3,681.3)Acquisitions--------Divestitures--------Others(2,255.2)420.0450.0450.0Cashflowfrominvestments(7,097.9)(3,797.5)(3,231.3)(3,231.3)Dividendspaid(common&pref)(654.6)(711.2)(846.5)(1,049.5)Inc/(dec)indebt4,776.53,000.03,000.03,000.0Commonstockissuance(repurchase)--------Otherfinancingcashflows(825.5)(879.8)(1,048.6)(1,162.2)Cashflowfromfinancing3,296.41,408.91,104.9788.3Totalcashflow(778.1)(247.2)851.91,722.7Balancesheet(Rmbmn)12/1712/18E12/19E12/20ECash&equivalents6,756.16,508.97,360.89,083.5Accountsreceivable17,048.221,303.725,149.030,228.7Inventory4,083.05,319.86,213.07,330.0Othercurrentassets5,194.05,194.05,194.05,194.0Totalcurrentassets33,081.338,326.443,916.851,836.1NetPP&E22,838.525,825.128,122.030,207.1Netintangibles2,254.62,197.12,139.72,082.2Totalinvestments3,692.94,031.04,369.04,707.0Otherlong-termassets10,920.610,920.610,920.610,920.6Totalassets72,787.881,300.189,468.099,753.0Accountspayable10,591.213,646.415,766.219,220.9Short-termloans5,999.05,999.05,999.05,999.0Othercurrentliabilities13,010.113,505.413,917.314,888.4Totalcurrentliabilities29,600.333,150.835,682.640,108.4Long-termdebt15,885.818,885.821,885.824,885.8Otherlong-termliabilities3,826.73,082.32,358.91,050.9Totallong-termliabilities19,712.521,968.124,244.725,936.7Totalliabilities49,312.855,118.959,927.366,045.1Preferredshares--------Totalcommonequity22,686.725,226.228,374.632,275.9Minorityinterest788.3955.01,166.11,432.0Totalliabilities&equity72,787.881,300.189,468.099,753.0BVPS(Rmb)6.387.097.989.08Ratios12/1712/18E12/19E12/20ECROCI(%)13.514.014.715.8ROE(%)14.314.115.717.2ROA(%)4.54.44.95.5Inventorydays81.181.386.383.1Receivablesdays247.0225.0232.7227.2Payabledays224.9209.6220.1214.8Netdebt/equity(%)64.470.269.564.7Interestcover-EBIT(X)3.33.23.74.4Valuation12/1712/18E12/19E12/20EP/Ebasic(X)9.77.25.84.7P/B(X)1.31.00.90.8EV/EBITDA(X)12.710.78.67.0EV/GCI(X)1.31.11.00.9Dividendyield(%)2.43.54.35.3Note:Lastactualyearmayincludereportedandestimateddata.Source:Companydata,GoldmanSachsResearchestimates.资料来源:Companydata,GaoHuaSecuritiesResearch
LargestturbinemakerinChinaIncorporatedin1998,Goldwindhasshippedmorethan44GWinwindturbinesgloballywitha29%marketshareinChinaand11%globallyin2017.Goldwindisalsoactivelydevelopingitsdownstreamwindfarmoperationbusiness.In2017,turbinesalesaccountedfor75%oftotalrevenuesandpowersalesfromitswindfarmsaccountedfor13%.Goldwindrecorded82%netincomeCAGRover2012-17.WebelieveGoldwind’scompetitiveadvantageliesinitssector-leadingturbinesystemdesignandcost-controlcapabilitytodriveitshigh-efficiencyandlow-costproductoffering.图表112:Goldwindhas11%globalshareforturbinesGlobalmarketshareofleadingturbinemakers(2017)图表113:Goldwindrecorded14%shipmentvolumeCAGRover2012-17WindturbineshipmentandsalesrevenueVestasOtherSiemens-GamesaNordexEnvisionGoldwindEnerconGE9,0008,0007,0006,0005,0004,0003,0002,0001,00035,000(MW)(Rmbmn)30,00025,00020,00015,00010,0005,000002015201620172018E2019E2020ETurbineshipmentRevenue(RHS)资料来源:Companydata资料来源:Companydata,GaoHuaSecuritiesResearch图表114:Windturbinesaccountedfor74%oftotalrevenuein2017Revenuebreakdownandblendedgrossmargins图表115:Goldwindrecorded82%netincomeCAGRover2012-17NetincomeandEBITmargins50,00045,00040,00035,00030,00025,00020,00015,00010,0005,00002015201620172018E2019E2020E31%(Rmbmn)30%29%28%27%26%25%24%6,0005,0004,0003,0002,0001,000014%(Rmbmn)12%10%8%6%4%2%0%WindturbineWindpowerservicesWindpowergenerationOthersBlendedgrossmargin(RHS)2015201620172018E2019E2020ENetincomeEBITmargin研究中国资料来源:Companydata,GaoHuaSecuritiesResearch资料来源:Companydata,GaoHuaSecuritiesResearch“OffshoreandOverseas”strategytodrivemarketshareexpansionWithaninnovativePMDD(permanentmagnetdirectdrive)solution,Goldwindhasconsistentlyrolledouthigh-efficiency,lower-maintenancecost,andgrid-friendlywindturbines.Thankstothehighqualityandhighcostperformanceofitsturbineproducts,GoldwindgrewitsChinamarketshare
from20%in2012to29%in2017.Goldwindtargetstohelpdownstreamwindfarmoperatorsreducelevelizedcostofelectricity(LCOE)byc.5%p.a.throughhigher-efficiencyandhigher-qualityturbines.
图表116:Goldwindhas29%marketshareinChinain2017MarketshareofleadingturbinemakersinChina(2017)图表117:Goldwind’smarketshareinChinarosefrom20%to29%over2012-17HistoricalshipmentvolumebyproductandChinamarketshare35%30%25%20%15%10%5%0%GoldwindEnvisionUnitedPowerMingyangShanghaiElectricCQHaizhuang8,0007,0006,0005,0004,0003,0002,0001,0000(MW)201220132014201520162017750KW1.5MW2.0MW2.5MW3.0MW6.0MWChinashare(RHS)30%25%20%15%10%5%0%资料来源:Companydata资料来源:CompanydataGoldwind’smanagementhasidentifiedoffshoreandoverseasmarketstobethenextdriverformarketsharegainsandhasbeenactivelyfocusingonits“offshoreandoverseas”strategy.Thecompanylaunchedanintegratedsolutionforoffshorewindpowerdevelopment“6.xmodel+integrateddesignsolutionsforsinglepile”,featuringlowinfrastructurecosts,lowliftingandmaintenancecostswhilecombiningthelargeimpellerandlargercapacityforturbinestoachievehighreturns.Asof3Q18,Goldwind’sturbineorderbacklogreachedahistoricalhighof18.2GW,amongwhichoffshoreprojectsandoverseasmarketreached1.38GWand737MWrespectively,representing8%and4%oftotalorderbacklog.WeexpectGoldwind’ssolidorderbacklogtosupportitswindturbinebusinessandforecast15%volumeCAGRand19%revenueCAGRover2018-20.图表118:Orderbacklogreachedahistoricalhighof18.2GWby3Q18Orderbacklogofwindturbines图表119:Higher-efficiencyandlarger-sized3Sand6Splatformorderscontributed8%and3%oftotalorderbacklog(asof3Q18)Breakdownofexternalorderbacklogbyproduct研究中国(MW)3S6S1.52.5S2S25,00020,00015,00010,0005,00002Q163Q164Q161Q172Q173Q174Q171Q182Q183Q18SignedbacklogSuccessfulbidInternalbacklog资料来源:Companydata资料来源:Companydata
图表120:OverseasandChinaoffshoreordersaccountedfor4%and8%oftotalorderbacklogBreakdownoforderbacklogbyregion图表121:Weforecast19%revenueCAGRover2018-20WindturbinesalevolumeandrevenueforecastsOffshore-domesticOnshore-overseasOnshore-domestic9,0008,0007,0006,0005,0004,0003,0002,0001,0000201620172018E2019E2020E35,000(MW)(Rmbmn)30,00025,00020,00015,00010,0005,0000研究中国1.5MW2.0MW2.5MW3.0MW6.0MWRevenue(RHS)资料来源:Companydata资料来源:Companydata,GaoHuaSecuritiesResearchIn2018,weexpectgrossmarginforturbinesalestofall3.3pptto22.3%dueto2-4%ASPdeclineacrossitsmajormodelsonmoreintensecompetition.Over2019-20,weexpectgrossmargintorecoverto23.0%and23.6%duetocostreductionasthecompanycontinuestoimproveproductefficiencytokeepupwithlowerASP.图表122:Weexpectgrossmargintofall3.3pptto22.2%in2018andrecoverto22.1%/22.8%in2019/20Grossmarginofturbinesales201620172018E2019E2020E33%28%23%18%13%8%3%-2%-7%1.5MW2.0MW2.5MW3.0MW6.0MWBlended资料来源:Companydata,GaoHuaSecuritiesResearchDevelopingwindfarmsoverseastoestablishglobalfranchiseGoldwindhas4.2GWwindfarmcapacityasof3Q18.Byleveragingitshigh-efficiencyturbinesandsolidknow-howonwindpowertech,Goldwind’sself-runwindfarmshaveconsistentlydeliveredhigherutilizationhoursthanthenationalaverage.Inordertofurtherestablishitsglobalfranchise,Goldwind
hasbeenactivelyexploringwindfarmdevelopmentoverseas.Asof3Q18,Goldwindhasc.3.2GWinwindprojectsunder
construction,1.4GWor39%ofwhichareoverseasprojects.WeexpectGoldwindtobuild600/500/500windfarmsgloballyanddispose250MWinwindfarmprojectseachyeartopromoteturbinesalesintargetedareasover2018-20.WebelievethiscouldhelpGoldwindestablishitsbrandequityintargetedoverseasmarketsandexpanditsglobalmarketshare.图表123:Goldwindhas4.2GWinattributablecapacityby3Q18InstalledcapacityofGoldwind’sself-runwindfarms图表124:Overseasprojectsaccountfor3%oftotalcapacityBreakdownofinstalledcapacitybyregionasof3Q184,5004,0003,5003,0002,5002,0001,5001,000500SouthChinaNortheastNorthChinaNorthwestOverseasEastChina(MW)17%4%4%3%34%38%0201320142015201620173Q18ControllingcapacityAttributablecapacity资料来源:Companydata资料来源:Companydata图表125:Goldwind’swindfarmshaveconsistentlydeliveredhigherutilizationthanthenationalaverageUtilizationhoursofGoldwind’sself-runwindfarmsvs.nationalaverage(hours/year)3,000图表126:39%ofprojectsunderconstructionarelocatedoverseasBreakdownofwindprojectsunderconstructionasof3Q18Northwest2502,5002,0001,500Northeast431SouthChina213Overseas13931,000500NorthChina4310201320142015201620173Q18NationalaverageutilizationGoldwind’sself-runwindfarmsEastChina852研究中国资料来源:Companydata资料来源:CompanydataInordertofund150MWinwindprojectsinMooraboolNorthand527.5MWinprojectsStockyardHill,GoldwindhasproposedonMarch23,2018toraiseRmb5bnthroughissuingnomorethan2A/Hrightsforvery10A/Hshares.Ifcompleted,theproposedrightissuewoulddilutethetotalnumberofsharesby20%assumingthemaximumadditionalnumberofsharesareraised.Wedonotfactorthisintoourestimatespendingcompletion.FinancialstatementanalysisP&L:WeexpectGoldwindtorecord20%revenueCAGRover2018-20mainlydrivenby15%shipmentCAGR.Weexpect2018grossmargintodeclineby
2pptto28%dueto
研究中国lowerturbineASPandrecoverto29.1%/29.5%in2019/20onbetterrevenuemix(higherportionofwindpowersales).Assuch,weforecast9.0%/10.7%/11.7%forEBITmarginandRmb3.39bn/Rmb4.20bn/Rmb5.20bnfornetincomein2018/19/20.BalanceSheet:Goldwind’snetgearingwas67%andcashbalancewasRmb6.8bnend-2017.Weexpectnetgearingtobe73%/72%/68%in2018/19/20asthecompanywouldneedtoincreaselong-termdebttosupportitswindfarmconstructionoverseas.CashFlow:WeforecastRmb4.2bn/Rmb3.7bn/Rmb3.7bncapexin2018/19/20,mainlytosupporttheconstructionofwindfarms.Weexpectthecompany’snetcashflowtobe-Rmb247mn/Rmb852mn/Rmb1.72bnin2018/19/20.
研究中国图表127:Keyassumptions201620172018E2019E2020ERevenueWindturbinesales22,51419,66724,31127,93634,141Services1,2462,0572,5713,2134,017Powergeneration2,4143,2474,2225,2776,332Total26,17424,97131,10336,42644,490GrossprofitWindturbinesales5,6764,8175,2296,2247,820Services201312398498603Powergeneration1,6812,3373,0823,8794,686Total7,5587,4668,70910,60013,109GrossmarginWindturbinesales25.2%24.5%21.5%22.3%22.9%Services16.1%15.2%15.5%15.5%15.0%Powergeneration69.6%72.0%73.0%73.5%74.0%Total28.9%29.9%28.0%29.1%29.5%2016E2017E2018E2018E2018EShipment1.5MW2,3436277507509002MW2,2143,0323,1003,2003,1002.5MW1,2451,3781,6252,1252,3753.0MWandabove2715180250500Others54303905601,120Total5,8835,0826,0456,8857,995Yoy-17%-14%19%14%16%ASP(Rmb/w)1.5MW3.603.643.533.503.462MW3.573.483.363.333.292.5MW4.134.053.913.833.763.0MWandabove4.786.796.686.556.49Total3.723.683.853.894.11Yoy-1%-1%4%1%6%Revenue1.5MW8,4442,2832,6492,6233,1162MW7,89910,53910,42010,64910,2132.5MW5,1395,5816,3548,1428,9183.0MWandabove3873053,8355,36310,619Others6469581,0541,1591,275Total22,51419,66724,31127,93634,141资料来源:Companydata,GaoHuaSecuritiesResearchInitiateH-shareatBuyandA-shareatNeutralGoldwind-Histradingat8.5x2019EEV/EBITDAcomparedtoitspast5-yearaverageandmedianof10.7xand10.7xrespectivelyanda10.2xaverageforitscomparablepeerswith9%-18%EBITDACAGRoverthelastfiveyears.Withgrowthoutlookabovethesectoraverage,weexpecttheH-sharetotradehighertowardsthehistoricalaverageofitspeergroup.Hence,weuseatarget2019EV/EBITDAmultipleof10x(inlinewiththe5-yearhistoricalaverageofitspeergroup)toderiveour12-monthtargetpriceofHKD10.4fortheH-share.
图表128:CurrentEV/EBITDAvs.peers图表129:Goldwind-Hshare’shistoricalEV/EBITDA1235%1030%25%820%615%410%25%18.0+1std:12.6xAve:10.7x-1std:8.7x16.014.012.010.08.06.04.000%Goldwind-H-currentPeergroupGoldwind-H-historical2.01/1/20141/1/20151/1/20161/1/20171/1/20182018EV/EBITDA2019EV/EBITDA18-20EEBITDAcagr(RHS)0.0资料来源:Wind,GaoHuaSecuritiesResearch资料来源:Wind,GaoHuaSecuritiesResearch图表130:HistoricalEV/EBITDAvs.EBITDACAGR1614121086420Goldwind-AVestasGoldwind-HHNRLongyuanNordexAverageMedian14-17EBITDAcagr(RHS)20%18%16%14%12%10%8%6%4%2%0%研究中国资料来源:Wind,GaoHuaSecuritiesResearchGoldwind-Aistradingat11.4x2019EEV/EBITDAcomparedtoitspast5-yearaverageandmedianof15.0xand14.6xrespectively.TheA-sharehastradedata47%premiumonaveragesincethebeginningof2013.WebelieveA-share’spremiumoverH-sharewasmainlyduetodifferentperceptionsofChinawindinstallationbyonshoreandoffshoreinvestors.Hence,weapply1stdbelowthehistoricalaveragetoGoldwind-AgivenitshistoricalpremiumoverGoldwind-H.Assuch,webaseour12-monthtargetpriceofRmb12.7fortheA-shareonatarget2019EV/EBITDAmultipleof12.3x.
图表131:Goldwind’sA-sharehasbeentradingatanaverageof47%premiumtotheH-sharesince2013HistoricalA-sharetoH-sharepremium%%%+1std:68%%%Ave:47%%-1std:27%%1/1/201310/1/20137/1/20144/1/20151/1/201610/1/20167/1/20174/1/2018140%图表132:Goldwind-Ashare’shistoricalEV/EBITDA+1std:17.05x-1std:14.7x-1std:12.4x25.012020.01008015.06010.040205.00-20%0.01/1/20141/1/20151/1/20161/1/20171/1/2018研究中国资料来源:Wind,GaoHuaSecuritiesResearch资料来源:Wind,GaoHuaSecuritiesResearch图表133:CurrentEV/EBITDAvs.peers1635%1430%1225%1020%815%610%425%00%Goldwind-A-currentPeergroupGoldwind-A-historical2018EV/EBITDA2019EV/EBITDA18-20EEBITDAcagr(RHS)资料来源:Wind,GaoHuaSecuritiesResearchKeyupside/downsiderisksHigher/lower-than-expectedturbineprices.TurbinepricesarecriticaltoGoldwind’sgrossmargin.Assuch,itsgrossmarginwouldbeimpactedifturbinepricesturnlower/higherthanexpected.Higher/lower-than-expectedturbineshipment.WeexpectGoldwindtorecord6.0/6.9/8.0GWinturbineshipmentsover2018-20E.Lower-than-expectedturbineshipmentwouldimpactrevenuefromturbinesalesandviceversa.Faster/slower-than-expectedwindfarmconstruction.WeexpectGoldwindtobuild600/500/500MWwindfarmsanddispose250MWinwindfarmprojectseachyeartopromoteoverseasturbinesalesandbuilditsbrandequity.Faster/slower-than-expectedwindfarmconstructionwouldimpactunderlyingrevenue.
研究中国HuanengRenewable(0958.HK):ContinuedimprovementinutilizationtodriveEBITmargin;initiateatBuyLeadingwindfarmoperator.Establishedin2002,HuanengRenewable(HNR)isaleadingwindfarmoperatorwith10.687GWinwindpowerand932MWinsolarpowercapacityasof1H18.ComparedtoLongyuan,HNRoperateswithhigherEBITmarginsonbettercostcontrol.In2017,HNRgenerated20,466GWhofwindpowerand1,200GWhofsolarpoweroutput,andrecordedRmb10.5bnrevenuefrompowersales.Withitshigh-qualityanddiversifiedadditionsandutilizationimprovementefforts,weexpectHNRtodeliver11%netincomeCAGRover2018-20.High-qualityanddiversifiedadditionstooptimizecapacityportfolio:Withacommitmenttoqualityandprofitabilityperthecompany’sstatedstrategy,HNRoperateshigh-qualitywindpowerandsolarfarmswithsector-leadingutilizationperformance.Tofurtheroptimizeitscapacityportfolio,weexpectHNRtoadd300/650/700MWwindand50/100/150MWsolarpowercapacityover2018/19/20,andtotalwindandsolarpowercapacitytoreach12.3GWand1.18GWrespectivelyasofend-2020.ContinuedimprovementinutilizationtodriveEBITmargin:Over2012-17,HNR’sEBITmarginwasthehighestamonglistedpeers,whichwebelieveisduetoitssector-leadingutilizationonthebackofitssolidprojectoriginationandoperatingcapability.Weforecast6%EBITCAGRover2018-20andEBITmarginexpandto55.5%/55.2%/55.7%overthesameperiod(vs.53.5%in2017),asweexpectHNR’sutilizationratetocontinuetoimproveasnationalcurtailmentpullsbackfurther.Keycatalysts:Better-than-expectedutilizationhours;faster-than-expectnewprojectconstruction.Undemandingvaluation:HNRistradingat5.9x2019EV/EBITDAvs.itspast3-yearaverageandmedianof7.4xand7.4x.Itscomparablepeershaveanhistoricalaverageof8.0xoverthesameperiod.Thesharesde-ratedsincethebeginningof2018,comparedtotheaverageof2016/17,oninvestorconcernsonsubsidypaymentsandutilizationinourview;however,weexpectthisissuetograduallyeaseasRPSisreinforced.Withthesepositivesanda42%upsidepotentialtoour12-monthtargetpriceofHKD3.0,weinitiatecoverageofHNRatBuy.
研究中国图表134:FinancialsummaryProfitmodel(Rmbmn)12/1712/18E12/19E12/20ETotalrevenue10,554.411,736.712,121.713,075.7Costofgoodssold(514.0)(564.4)(601.3)(654.2)SG&A(247.6)(275.3)(254.6)(261.5)R&D--------Otheroperatingprofit/(expense)(343.4)(430.5)(452.5)(504.4)EBITDA9,449.410,466.510,813.311,655.5Depreciation&amortization(3,798.5)(3,953.7)(4,124.3)(4,368.7)EBIT5,650.96,512.86,689.07,286.8Interestincome57.355.1114.3131.3Interestexpense(2,176.4)(2,087.4)(1,999.7)(1,933.0)Income/(loss)fromuncons.subs.--------Others(124.1)(140.0)(75.0)(75.0)Pretaxprofits3,407.74,340.54,728.75,410.2Incometax(346.3)(695.3)(781.1)(893.5)Minorities(49.6)(66.3)(69.1)(79.0)Netincomepre-preferred3,011.73,578.93,878.54,437.6Preferreddividends--------Netincome(pre-exceptionals)3,011.73,578.93,878.54,437.6Posttaxexceptionals--------Netincome3,011.73,578.93,878.54,437.6EPS(basic,pre-except)(Rmb)0.290.340.370.42EPS(basic,post-except)(Rmb)0.290.340.370.42EPS(diluted,post-except)(Rmb)0.290.340.370.42DPS(Rmb)0.040.050.060.06Dividendpayoutratio(%)14.615.115.115.1Freecashflowyield(%)10.332.311.743.2Growth&margins(%)12/1712/18E12/19E12/20ESalesgrowth14.211.23.37.9EBITDAgrowth12.910.83.37.8EBITgrowth15.115.32.78.9Netincomegrowth13.318.88.414.4EPSgrowth7.515.38.414.4Grossmargin95.195.295.095.0EBITDAmargin89.589.289.289.1EBITmargin53.555.555.255.7Cashflowstatement(Rmbmn)12/1712/18E12/19E12/20ENetincomepre-preferreddividends3,011.73,578.93,878.54,437.6D&Aadd-back3,798.53,953.74,124.34,368.7Minoritiesinterestsadd-back49.666.369.179.0Net(inc)/decworkingcapital(1,654.9)1,281.6(1,566.3)957.3Otheroperatingcashflow2,350.22,037.31,890.41,806.6Cashflowfromoperations7,555.110,917.88,396.011,649.4Capitalexpenditures(5,117.4)(4,120.3)(5,916.7)(2,415.7)Acquisitions--------Divestitures--------Others926.61,071.51,163.51,261.5Cashflowfrominvestments(4,190.9)(3,048.8)(4,753.2)(1,154.2)Dividendspaid(common&pref)(433.2)(454.4)(539.9)(585.1)Inc/(dec)indebt(1,156.5)(2,700.0)(400.0)(4,000.0)Commonstockissuance(repurchase)1,908.8------Otherfinancingcashflows(3,750.7)(2,021.0)(1,930.6)(1,853.9)Cashflowfromfinancing(3,431.6)(5,175.4)(2,870.5)(6,439.0)Totalcashflow(67.4)2,693.6772.24,056.1Balancesheet(Rmbmn)12/1712/18E12/19E12/20ECash&equivalents2,502.75,196.35,968.510,024.6Accountsreceivable7,214.05,969.77,513.76,600.9Inventory55.337.561.446.2Othercurrentassets1,469.71,469.71,469.71,469.7Totalcurrentassets11,241.812,673.215,013.318,141.4NetPP&E71,406.171,190.972,407.770,257.0Netintangibles978.2929.6880.9832.3Totalinvestments253.9229.5205.0180.6Otherlong-termassets2,468.61,902.01,496.5632.1Totalassets86,348.686,925.190,003.590,043.5Accountspayable156.1175.5177.1206.5Short-termloans20,705.219,205.219,005.217,005.2Othercurrentliabilities6,224.76,310.36,355.56,439.8Totalcurrentliabilities27,086.125,691.025,537.823,651.5Long-termdebt30,682.229,482.229,282.227,282.2Otherlong-termliabilities3,138.43,138.43,138.43,138.4Totallong-termliabilities33,820.632,620.632,420.630,420.6Totalliabilities60,906.758,311.657,958.454,072.1Preferredshares--------Totalcommonequity24,601.627,640.630,934.034,702.1Minorityinterest840.3973.01,111.11,269.2Totalliabilities&equity86,348.686,925.190,003.590,043.5BVPS(Rmb)2.332.622.933.28Ratios12/1712/18E12/19E12/20ECROCI(%)10.09.99.811.9ROE(%)13.513.713.213.5ROA(%)3.54.14.44.9Inventorydays31.330.030.030.0Receivablesdays204.9205.0203.0197.0Payabledays107.2107.2107.0107.0Netdebt/equity(%)192.1152.0132.195.3Interestcover-EBIT(X)2.73.23.54.0Valuation12/1712/18E12/19E12/20EP/Ebasic(X)7.65.65.24.5P/B(X)1.00.70.60.6EV/EBITDA(X)7.76.25.94.8EV/GCI(X)0.80.70.60.5Dividendyield(%)1.92.72.93.3Note:Lastactualyearmayincludereportedandestimateddata.Source:Companydata,GoldmanSachsResearchestimates.资料来源:Companydata,GaoHuaSecuritiesResearch
LeadingwindfarmoperatorEstablishedin2002,HNRisaleadingwindfarmoperatorwith10.687GWinwindpowerand932MWinsolarpowercapacityasof1H18.In2017,HNRgenerated20,466GWhofwindpowerand1,200GWhofsolarpoweroutput,andrecordedRmb10.5bnrevenuefrompowersales.ComparedtoLongyuan,HNRoperateswithsimilarutilizationhoursbuthashigherEBITmarginsduetobettercontrol.图表135:HNRhas10.7GWand880MWofwindandsolarpowercapacitybyend-2017Accumulativeconsolidatedcapacitybreakdown图表136:HNRrecorded20,466Gwhwindpoweroutputin2017On-gridoutpoweroutput16,00030,000(Gwh)14,00012,00010,00025,00020,000(MW)8,00015,0006,0004,0002,00010,0005,00002015201620172018E2019E2020E02015201620172018E2019E2020EWindSolarWindSolar资料来源:Companydata,GaoHuaSecuritiesResearch资料来源:Companydata,GaoHuaSecuritiesResearch图表137:Powersalesaccountedfor99%oftotalrevenuein2017Revenuebreakdownbysegment(Rmbmn)14,00012,00010,0008,0006,0004,0002,0000图表138:HNRrecorded40%netincomeCAGRover2012-17NetincomeandEBITmargin(Rmbmn)3,5003,0002,5002,0001,5001,00050058%56%54%52%50%48%46%44%2015201620172018E2019E2020ESalesofelectricityServiceconcessionconstructionrevenueOthers0201220132014201520162017NetincomeEBITmargin42%研究中国资料来源:Companydata,GaoHuaSecuritiesResearch资料来源:Companydata,GaoHuaSecuritiesResearchHigh-qualityanddiversifiedadditiontooptimizecapacityportfolioHNR’swindandsolarpowerprojectsboastsector-leadingutilizationperformanceamonglistedpeers—over2016-17,HNRoperatedwiththehighestutilizationhoursamonglistedpeers.Webelievethisisbecausemorethan50%ofitswindcapacityarelocatedinIVwindresourcezones,whichhavelowercurtailmentrisks.HNR’ssolarpowerprojectsrecordedanaverageof1,590utilizationhoursin2017and839utilizationhoursin1H18,32%/31.7%higherthanthenationalaverage.
图表139:Capacitydistributionbyregion图表140:HNRoperateswiththehighestaverageutilizationamongpeersover2016-17AveragewindpowerutilizationhourofHuanengRenewable/LongyuanPower/DatangRenewable/nationalaverage12,00010,0002,2002,100(hours)8,0002,000(MW)6,0001,9004,0002,00002012201320142015201620171H181,8001,7001,6001,500InnerMongoliaLiaoningShandongYunnanShanxiGuizhouGuangdongHebeiSichuanXinjiangShanghaiJilinShaanxiZhejiangGuangxi201220132014201520162017HNRLYPDatangNationalaverage研究中国资料来源:Companydata资料来源:CompanydataWeexpectHNRtocontinueoptimizeitscapacityportfoliothroughhigh-qualityanddiversifiedprojectadditionsandtoadd300/650/700MWinwindcapacityand50/100/150MWinsolarpowercapacityover2018/19/20,withtotalwindandsolarpowercapacityreaching12.3GWand1.18GWrespectivelybyend-2020.图表141:WeexpectHNRtoadd300/650/700MWand50/100/150MWinwindandsolarcapacityover2018/19/20Windandsolarinstalledcapacityforecasts(MW)(MW)16,00080014,00070012,00060010,0005008,0004006,0003004,0002002,00010000201620172018E2019E2020EWind-AccSolar-AccWind-newaddition(RHS)Solar-newaddition(RHS)资料来源:Companydata,GaoHuaSecuritiesResearchContinuedimprovementinutilizationtodriveEBITmarginOver2012-17,HNRoperatedwiththehighestEBITmarginamonglistedpeers,whichweattributetoitssector-leadingutilizationonthebackofitssolid
projectoriginationandoperatingcapability.In1H18,HNRrecorded1,229utilizationhoursin1H18,up10.8%
yoy,duetorobustpowerdemandandstrengthenedabsorptionofrenewableenergytothegridinChina.图表142:HNRoperateswiththehighestEBITmarginamonglistedpeersEBITmarginofHuanengRenewable/LongyuanPower/DatangRenewable/HuadianFuxin图表143:WeexpectHNR’sEBITmargintoexpandfrom53.5%in2017to55.5%/55.2%/55.7%over2018/19/20EBITandEBITmarginforecasts60%55%50%45%40%35%30%25%20%201220132014201520162017HNRLYPDatangHDFX8,0007,0006,0005,0004,0003,0002,0001,0000201620172018E2019E2020EEBITEBITmargin(RHS)56%(Rmbmn)56%55%55%54%54%53%53%52%52%研究中国资料来源:Companydata,Wind资料来源:Companydata,GaoHuaSecuritiesResearchDrivenbyimprovingutilization,1H18EBITmarginroseto61.2%.WeexpectHNRtorecord6%EBITCAGRover2018-20andEBITmargintoexpandto55.5%/55.2%/55.7%in2018/19/20comparedwith53.5%in2017,HNR’sutilizationcouldcontinuetoimproveasnationalcurtailmentpullsbackfurther.FinancialstatementanalysisP&L:Weforecast6%revenueCAGRover2018-20onmoderatecapacityadditionandutilizationimprovement(vs.3%CAGRforutilizationover2018-20).WeexpectEBITmargintobe55.5%/55.2%/55.7%in2018/19/20.WeexpectHNRtorecordnetincomeofRmb3.58bn/Rmb3.88bn/Rmb4.44bnin2018/19/20,implying11%netincomeCAGR,inlinewithLongyuan.BalanceSheet:HNR’snetgearingwas192%byend-2017.Weexpectnetgearingtofallto152%/131%/96%duetomoderatecapexspendingasthecompanyistryingtofocusmoreonprojectqualityandprofitability.Weforecast2018-20receivabledaysbe205/203/197over2018/19/20duetoimprovedsubsidypayment.CashFlow:WeexpectRmb4.1bn/Rmb5.9bn/Rmb2.4bncapexin2018/19/20,mainlytosupporttheconstructionofwindfarmprojects.Assuch,weexpectthecompany’snetcashflowtobeRmb2.69bn/Rmb747mn/Rmb4.05bnin2018/19/20.UndemandingvaluationHNRistradingat5.9x2019EV/EBITDAvs.itspast3-yearaverageandmedianof7.4xand7.4x.Itscomparablepeershaveanhistoricalaverageof8.0xoverthesameperiod.Sincethebeginningof2018,HNRhasbeentradingbetweenitspast3-yearaverageand1stdbelowaverage.Thesharesappeartohave
de-ratedin2018comparedtotheaverageof2016/17,likelyduetoinvestorconcernsonsubsidypaymentandutilization.WebelievethesecouldbegraduallyimprovedasRPSbecomesreinforced.Weadopt0.5stdbelowhistoricalaverage(equivalenttothemedianofitsYTDrange)asourtarget
multiple.Webasedour12-monthtargetpriceofHKD3.0onatarget2019EV/EBITDAmultipleof6.5x(0.5stdbelowhistoricalaverage).图表144:HistoricalEV/EBITDA图表145:CurrentEV/EBITDAvs.peers+1std:9.1xAve:7.5x-1std:5.9x10.09.08.07.06.05.04.03.02.01.00.01/1/20167/1/20161/1/20177/1/20171/1/20187/1/201886%76%65%545%34%24%103%HNR-currentPeergroupHNR-historical2018EV/EBITDA2019EV/EBITDA18-20EEBITDAcagr(RHS)资料来源:Wind,GaoHuaSecuritiesResearch资料来源:Wind,GaoHuaSecuritiesResearch图表146:HistoricalEV/EBITDAvs.EBITDACAGR109876543DatangHNRLongyuanEDPRenovaveisAverageMedian13-17EBITDAcagr(RHS)20%18%16%14%12%10%8%6%4%2%0%研究中国资料来源:Wind,Bloomberg,GaoHuaSecuritiesResearchKeydownsiderisksLower-than-expectedutilizationhours.Utilizationhourisdeterminedbywindresourcesandgridabsorption.Eitherlower-than-expectedwindresourcesorgridabsorptionwouldresultinlower-than-expectedutilizationhoursforthecompany.Thiswoulddragonthecompany’sEBITmarginsandposedownsideriskstoourestimates.Slower-than-expectednewcapacityaddition.WeforecastHNRtoadd350/750/850MWincapacityover2018-20E.Ifcapacityadditionsturnsouttobeslowerthanexpected,ourrevenueforecastswouldbeexposedtodownsiderisks.Higher-than-expectedrepairandmaintenancecost.Windturbinesusuallyoffer5-7yearsofwarranty.Ifturbinesdonotfunctionnormallyaftertheexpirationofwarranty,repairandmaintenancecostwouldbehigherthan
expected.Assuch,HNR’sEBITmarginwouldbedraggedbyhigher-than-expectedrepairandmaintenancecost.
研究中国XinyiSolar(0968.HK):LeadingPVglassmaker,butvaluationpremiumunjustified;initiateatSellXinyiisaleadingglobalsolarglassmanufacturerwith6,800tonsofdailymeltingcapacity.WeestimatethatXinyihasac.30%shareinChina’sPVglassmarketasofend-2017.In2017,upstreamPVglassaccountedfor60%oftotalrevenue.ThecompanyhasalsobeenactivelyexpandingdownstreamtosolarfarmoperationsandEngineering,ProcurementandConstruction(EPC)services,with1.75GWsolarfarmsconnectedtothegridbyend-2017.Well-positionedtogainmarketshareamiddownturnbutcompetitionmayremainintenseintheshortterm:XinyiSolarrecorded44%revenueCAGRand81%netprofitCAGRover2012-17.However,PVglasspriceshavefallenby19%sinceend-May2018(21%YTD)asChinademandhasslowedin2H18.WeexpectXinyitograduallygainmarketshareduringthisroundofsectorconsolidationonthebackofitsstrongercostadvantageandbalancesheetbutforcompetitiontoremainintenseintheshortterm.AccordingtoSci99,totalcapacityofultra-whiteprocessedPVglassinChinafell9%fromJune2018butisstill5%higherthaninNovember2017.WeforecastXinyiSolartodeliver22%revenueCAGRforPVglasssalesover2018-20.Solarfarmoperationtoexpandsteadily:Throughanecologicalagriculturemodelofgeneratingelectricityaboveground,breedingandplantingunderground,Xinyihasanaggregateof1.75GWsolarfarmsbyend-2017.WeexpectXinyiSolartoadd150/200/300MWofsolarfarmprojectsin2018/19/20,andpowersalesrevenuetorecord13%CAGR,andgrossmargintoexpandfrom76.2%in2018to77.4%in2020asutilizationrampsup.Keycatalysts:Lower-than-expectedgrossmarginforPVglasssales;slower-than-expectedcapacityaddition.Valuationpremiumoverpeersunjustified:WhileweseebetterprofitabilityandgrowthoutlookforXinyivs.peersgivenitsmorediversifiedbusinesses,webelieveitsvaluationpremium(8.4x2019EV/EBITDA)isunjustifiedwithourtoppicksmostlytradingbelowthehistoricalaverageoftheirpeergroup(7.4x).Hence,weinitiatecoverageofXinyiSolaratSellwitha12-monthtargetpriceofHKD2.6,implying8%downsidepotentialvs.27%averageupsideforoursolarcoverage.
研究中国图表147:FinancialsummaryProfitmodel(HK$mn)12/1712/18E12/19E12/20ETotalrevenue9,527.07,428.98,652.410,329.6Costofgoodssold(6,122.4)(4,568.7)(5,287.4)(6,251.6)SG&A(671.9)(512.6)(597.0)(712.7)R&D--------Otheroperatingprofit/(expense)--------EBITDA3,282.03,104.33,616.94,290.9Depreciation&amortization(549.3)(756.8)(848.9)(925.7)EBIT2,732.72,347.52,768.03,365.3Interestincome14.117.828.038.7Interestexpense(178.6)(230.3)(282.3)(312.6)Income/(loss)fromuncons.subs.3.6------Others217.7225.0225.0220.0Pretaxprofits2,789.42,360.12,738.73,311.4Incometax(265.3)(224.2)(273.9)(397.4)Minorities(192.1)(163.0)(145.8)(194.3)Netincomepre-preferred2,332.01,972.92,319.02,719.7Preferreddividends--------Netincome(pre-exceptionals)2,332.01,972.92,319.02,719.7Posttaxexceptionals--------Netincome2,332.01,972.92,319.02,719.7EPS(basic,pre-except)(HK$)0.330.260.300.36EPS(basic,post-except)(HK$)0.330.260.300.36EPS(diluted,post-except)(HK$)0.330.260.300.36DPS(HK$)0.150.120.140.16Dividendpayoutratio(%)46.045.045.045.0Freecashflowyield(%)(6.1)4.33.36.1Growth&margins(%)12/1712/18E12/19E12/20ESalesgrowth58.6(22.0)16.519.4EBITDAgrowth23.2(5.4)16.518.6EBITgrowth20.7(14.1)17.921.6Netincomegrowth17.4(15.4)17.517.3EPSgrowth11.6(21.0)17.517.3Grossmargin35.738.538.939.5EBITDAmargin34.441.841.841.5EBITmargin28.731.632.032.6Cashflowstatement(HK$mn)12/1712/18E12/19E12/20ENetincomepre-preferreddividends2,332.01,972.92,319.02,719.7D&Aadd-back549.3756.8848.9925.7Minoritiesinterestsadd-back(192.1)(163.0)(145.8)(194.3)Net(inc)/decworkingcapital(1,956.0)782.8(85.4)(124.3)Otheroperatingcashflow565.0163.0145.8194.3Cashflowfromoperations1,298.23,512.53,082.53,521.1Capitalexpenditures(2,511.1)(2,500.0)(2,300.0)(2,100.0)Acquisitions--------Divestitures--------Others20.7------Cashflowfrominvestments(2,490.4)(2,500.0)(2,300.0)(2,100.0)Dividendspaid(common&pref)(1,039.3)(1,072.7)(887.8)(1,043.6)Inc/(dec)indebt1,266.8800.0700.0700.0Commonstockissuance(repurchase)1,506.8------Otherfinancingcashflows(4.8)------Cashflowfromfinancing1,729.5(272.7)(187.8)(343.6)Totalcashflow537.3739.8594.71,077.5Balancesheet(HK$mn)12/1712/18E12/19E12/20ECash&equivalents1,380.62,120.32,715.13,792.5Accountsreceivable4,166.62,544.12,915.73,424.3Inventory373.9312.9347.7393.9Othercurrentassets1,545.41,545.41,545.41,545.4Totalcurrentassets7,466.56,522.87,523.99,156.3NetPP&E14,240.015,990.617,449.018,630.6Netintangibles345.7345.7345.7345.7Totalinvestments0.00.00.00.0Otherlong-termassets715.01,055.61,038.3540.5Totalassets22,767.323,914.726,356.928,673.0Accountspayable2,940.92,040.32,361.22,791.8Short-termloans3,145.33,145.33,145.33,145.3Othercurrentliabilities154.6154.6154.6154.6Totalcurrentliabilities6,240.85,340.25,661.16,091.7Long-termdebt4,787.45,587.46,287.46,987.4Otherlong-termliabilities58.658.658.658.6Totallong-termliabilities4,846.15,646.16,346.17,046.1Totalliabilities11,086.910,986.212,007.213,137.8Preferredshares--------Totalcommonequity10,121.111,206.212,481.713,977.5Minorityinterest1,559.21,722.21,868.01,557.7Totalliabilities&equity22,767.323,914.726,356.928,673.0BVPS(HK$)1.421.461.631.82Ratios12/1712/18E12/19E12/20ECROCI(%)20.814.615.415.9ROE(%)28.518.519.620.6ROA(%)11.88.59.29.9Inventorydays19.727.422.821.6Receivablesdays118.5164.9115.2112.0Payabledays163.3199.0151.9150.4Netdebt/equity(%)56.151.146.840.8Interestcover-EBIT(X)16.611.010.912.3Valuation12/1712/18E12/19E12/20EP/Ebasic(X)7.911.09.48.0P/B(X)1.81.91.71.6EV/EBITDA(X)8.19.78.46.9EV/GCI(X)1.41.41.31.2Dividendyield(%)5.84.14.85.6Note:Lastactualyearmayincludereportedandestimateddata.Source:Companydata,GoldmanSachsResearchestimates.资料来源:Companydata,GaoHuaSecuritiesResearch
LeadingglobalsolarglassmanufacturerXinyiSolarisaleadingglobalsolarglassmanufacturerwithdailymeltingcapacityof6,800tons.WeestimatethatXinyihasac.30%shareinChina’sPVglassmarketasofend-2017.Keyproductsinclude:fullyfinishedtemperedanti-reflectivecoatedpatternsolarglassandbackglass.XinyiSolarhasalsobeenactivelyexpandingdownstreamtosolarfarmoperationsandEPCservices,with1.75GWsolarfarmsconnectedtothegridbyend-2017.In2017,upstreamPVglassaccountedfor60%oftotalrevenue.XinyiSolarrecorded44%revenueCAGRand81%netprofitCAGRover2012-17.图表148:Xinyihasdailymeltingcapacityof6,800tonsbyend-2017DailymeltingcapacityandsalesvolumeofPVglass图表149:Xinyihas1.75GWsolarfarmsconnectedtothegridbyend-2017SolarfarmscaleandaverageFiT9,0008,0007,0006,0005,0004,0003,0002,0001,00002015201620172018E2019E2020EDailymeltingcapacityPVglasssalesvol(RHS)2,500(Ton/day)(’000Ton)2,0001,5001,00050002,0001,8001,6001,4001,2001,00080060040020002014201520162017AnhuiOthersAverageFiT(RHS)1.01(MW)(Rmb/kwh)1.000.990.980.970.960.950.94资料来源:Companydata,GaoHuaSecuritiesResearch资料来源:Companydata图表150:Solarglassaccountedfor60%oftotalrevenuein2017Revenuebreakdownandblendedgrossmargin图表151:XinyiSolarrecorded81%netincomeCAGRover2012-17NetincomeandEBITmargin12,00010,0008,0006,0004,0002,0000(HKDmn)2015201620172018E2019E2020ESolarglassSolarEPCSolarfarmBlendedgrossmargin(RHS)50%45%40%35%30%25%20%15%10%5%0%3,0002,5002,0001,5001,00050002015201620172018E2019E2020ENetincomeEBITmargin(RHS)40%(HKDmn)35%30%25%20%15%10%5%0%研究中国资料来源:Companydata,GaoHuaSecuritiesResearch资料来源:Companydata,GaoHuaSecuritiesResearchWell-positionedtobenefitfromrisingbifacialdual-glasssolutionsoverthelongtermAspartofacontinuedefforttoimproveefficienciesandcostperformance,modulemanufacturershaveincreasedtheadoptionofbifacialdual-glasssolutiontoreplacethetraditionalaluminumframesandthebacksheetsubstratewithPVglass.Thebifacialcellsarethereforefullyencapsulatedin
glassandcangenerateanextra10-30%powerfromthebacksheet.AccordingCPIA,thepenetrationofdual-glasssolutionamongChinamodulemakersisexpectedtorisefrom8%in2017to35%in2025.Webelieve
thistrendcouldeffectivelyincreasethedemandforsolarglass.Assuch,XinyiSolariswell-positionedtoleverageontherisingdemandforsolarglassonthebackofitsexpandingcapacitiesandleadingcostadvantageinourview.图表152:Theadoptionofsolarglassasbackcovertorisefrom8%in2017to35%in2025Portionofdifferentmaterialsusedinbackcoverofmodule图表153:Risingpenetrationofdual-glassmodulesinChinaPenetrationofdual-glassmodulesamongsurveyedmanufacturers100%90%80%70%60%50%40%30%20%10%0%6543212016201720182020202220250TPTbacksheetnon-TPTbacksheetGlassbacksheet20172018ProductionPenetration(RHS)18%(GW)16%14%12%10%8%6%4%2%0%资料来源:CPIA资料来源:BloombergNEFXinyi’sultra-clearPVglassfeaturesoutstandingperformance(asevidentfromitsmarketshare—thelargestinChina)suchaslighttransmittance,lowabsorptionrate,lowreflectivityandlowironcontent,couldeffectivelyimprovephotoelectricandphotothermalconversionefficiency.Withdailymeltingcapacityof6,800tons,weestimateXinyiaccountedfor30%shareofChina’sPVglassmarketinend-2017.WeexpectXinyitofurtherexpanddailymeltingcapacityto8,500tonsby2020.WebelieveXinyi’shigh-qualityproductsandexpandingcapacitywillallowittobeakeybeneficiaryoftherisingdemandforPVglassinChina.图表154:Dailymeltingcapacityoftop5PVglassmakersinChina(asofOct2018)图表155:WeexpectPVglasscapacitytoexpandfrom6,800tons/daybyend-2017to8,500tons/daybyend-2020PVglasscapacityandsalesvolumeforecasts6,0005,0009,0008,0007,0002,500(Ton/day)(’000ton)2,0004,0003,0002,0001,0006,0005,0004,0003,0002,0001,0001,5001,000500(Ton/day)0XinyiFlatRainbowCNBMJinxingXinyiFlatRainbowCNBMJinxing00201620172018E2019E2020ECapacitySalesvol研究中国资料来源:Sci99资料来源:Companydata,GaoHuaSecuritiesResearch
图表156:XinyihasthehighestrevenuescaleandgrossmarginsamonglistedpeersPVglassrevenues/grossmarginsofFlat/Xinyi/Almaden6,000(Rmbmn)40%5,0004,00035%30%25%3,00020%2,0001,00015%10%5%00%20171H18Almaden-revFlat-revXinyi-revFlat-grossmargin(RHS)Xinyi-grossmargin(RHS)Almaden-grossmargin(RHS)资料来源:CompanydataCompetitiontoremainintenseintheshorttermSinceNEApublishedthenoticetohaltquotasforutility-levelsolarfarmsinMay,Chinademandhasfallensharplyin3Q18andthepriceofPVglassby19%sinceend-May2018(21%YTD).WeexpectXinyi’sPVglasssegmenttoseea3%declineinshipmentvolumeand15%declineinASPin2018,drivingrevenuesforPVglasstofall15%yoytoHKD4.87bnin2018,andgrossmargintofall4.2pptyoyto26%.图表157:PricesofPVglassdeclinedby19%sinceMay2018and21%YTDAveragepriceofultra-clearprocessedPVglass图表158:WeexpectPVglasssalesvolumetodeclineby3%in2018,butrise20%in2019and22%in2020PVglassrevenue,salesvolumeandASPforecasts32.030.028.026.024.022.020.018.02017-01-012017-01-222017-02-122017-03-052017-03-262017-04-162017-05-072017-05-282017-06-182017-07-092017-07-302017-08-202017-09-102017-10-012017-10-222017-11-122017-12-032017-12-242018-01-142018-02-042018-02-252018-03-182018-04-082018-04-292018-05-202018-06-102018-07-012018-07-222018-08-122018-09-022018-09-232018-10-142018-11-042018-11-2516.08,00028(HKDmn/’000ton)(Rmb/m2)7,000276,000265,000254,000243,000232,000221,00021研究中国020201620172018E2019E2020ERevenueSalesvolASP(RHS)资料来源:Sci99资料来源:Companydata,GaoHuaSecuritiesResearchAccordingtoSci99,totalcapacityofultra-whiteprocessedPVglassinChinashrankfrom22,740tons/dayinJuneto20,690tons/dayinNovemberin2018,butisstill5%higherthan19,640tons/dayinNovember2017.WeexpectXinyitograduallygainmarketshareduringthisroundofindustryconsolidationonthebackofitsstrongercostadvantageandbalancesheet,however,weexpectthecompetitiontoremainintenseintheshortterm.Over2019-20,weexpectXinyitorecord20%/22%volumegrowthwithflattishASP.
图表159:Sectorcapacitydown9%fromJune2018butstill5%higherthanNovember2017TotalcapacityofultrawhitePVprocessedglass(ton/day)23,00022,00021,00020,00019,00018,00017,000资料来源:SCi99SolarfarmoperationtoexpandsteadilyXinyiSolardevelopsdownstreamsolarfarmsthroughanecologicalagriculturemodelofgeneratingelectricityaboveground,breedingandplantingunderground,installinganaggregateof1.75GWinsolarfarmsbyend-2017.Withc.67%ofitscapacitylocatedinAnhui,XinyileveragessignificantscaleeffectinitssolarfarmoperationandenjoysthehighestgrossmarginforsolarpowersalesamongleadingplayersinChina.图表160:WeexpectXinyi’ssolarfarmcapacitytoreach2.4GWbyend-2020Solarfarmcapacityandrevenueforecasts图表161:XinyienjoysthehighestgrossmarginforsolarpowersalesamongleadingpeersGrossmarginofsolarpowersalesamongleadingplayers(2017)3,0002,5002,500(MW)(HKDmn)2,00080%75%2,0001,5001,0005001,5001,00050070%65%60%00201620172018E2019E2020ECapacityRevenue55%XinyiLongiLinyangSungrowGCLnewenergyJinyuntong研究中国资料来源:Companydata,GaoHuaSecuritiesResearch资料来源:CompanydataWeexpectXinyiSolartoadd150/200/300MWofsolarfarmprojectsin2018/19/20,andpowersalesrevenuetorecord13%CAGR,andgrossmargin
toexpandfrom76.2%in2018to77.4%in2020asutilizationrampsup.
图表162:WeexpectXinyiSolartoadd150/200/300MWofsolarfarmprojectsover2018-20Accumulativecapacityandnewadditionforecast图表163:Weexpectpowersalesrevenuetorecord13%CAGRover2018-20Solarpowersalesrevenueandgrossmarginforecast3,0002,5002,5002,00078%(HKDmn)77%2,0001,5001,0005001,5001,00050076%75%74%73%(MW)0201620172018E2019E2020EAccumulativecapacityNewaddition0201620172018E2019E2020ERevenueGrossmargin(RHS)72%研究中国资料来源:Companydata,GaoHuaSecuritiesResearch资料来源:Companydata,GaoHuaSecuritiesResearchFinancialstatementanalysisP&L:WeexpectXinyiSolartorecorda22%declineinrevenuesin2018dueto15%lowerASPanda3%PVglassshipmentdecline.However,weexpectrevenuestogrow16%/19%in2019/20asChinademandrecoversandXinyi’smarketshareexpands.WeforecastgrossmarginofPVglasstodecline4.2ppto26%in2018butconsolidatedgrossmargintoexpand2.8ppto38.5%onbetterrevenuemix(higherrevenuecontributionfromsolarfarmoperationwhichoffers76.2%grossmarginin2018onourestimate).Weforecast2019-20grossmargintobe38.9%/38.5%asPVglassmarginrecovers.Overall,weexpect2018-20EBITmargintobe31.6%/32.0%/32.6%andnetincometobeRmb1.97bn/Rmb2.32bn/Rmb2.72bn.Our2018-19Enetincomeestimateare4%/1%belowconsensusand2020estimate2%aboveconsensus.BalanceSheet:Xinyi’snetgearingwas65%andcashbalanceRmb1.4bnbytheendof2017.Weexpect2018/19/20netgearingtobelowerat59%/54%/45%withmoderatecapexspending—2018-20solarfarmadditionstobethan2016-17.CashFlow:WeexpectXinyitorecordRmb2.5bn/Rmb2.3bn/Rmb2.1bncapexin2018/19/20,mainlytosupporttheconstructionofsolarfarmprojectsandPVglasscapacityWeexpectthecompany’snetcashflowtobeRmb740mn/Rmb595mn/Rmb1,077mnin2018/19/20.Valuationpremiumoverpeersunjustified,initiateatSellWeuseatarget2019EV/EBITDAmultipleof7.4x(inlinewiththe5-yearhistoricalaverageofitspeergroup)toderiveour12-monthtargetprice.XinyiSolaristradingat8.4x2019EV/EBITDA,lowerthanitshistoricalaverageof12.7xEV/EBITDA,buthigherthancomparablepeers’historicalaverageof7.4x.WhileweseebetterprofitabilityandgrowthoutlookforXinyivs.peersgivenitsmorediversifiedbusinesses,webelieveitsvaluation
premiumisunjustifiedwithourtoppicksmostlytradingbelowthehistoricalaverageoftheirpeergroup.WeinitiatecoverageofXinyiSolaratSellwitha12-monthtargetpriceofHKD2.6,implying8%downsidepotentialvs.27%averageupsideforoursolarcoverage.
图表164:CurrentEV/EBITDAvs.peers图表165:HistoricalEV/EBITDA1420%18%16%14%25.012%10%20.0121035.0+1std:18.7xAve:12.7x-1std:6.7x30.0868%46%4%22%00%Xinyi-currentPeergroupXinyi-historical15.010.05.02018EV/EBITDA2019EV/EBITDA18-20EEBITDAcagr(RHS)0.012/12/201312/12/201412/12/201512/12/201612/12/2017资料来源:Wind,GaoHuaSecuritiesResearch资料来源:Wind,GaoHuaSecuritiesResearch图表166:HistoricalEV/EBITDA14121086420XinyisolarChintCSIQJKSFlatAverageMedian13-17EBITDAcagr(RHS)80%70%60%50%40%30%20%10%0%-10%研究中国资料来源:Wind,GaoHuaSecuritiesResearchWhatwouldmakeusmorepositive/keyupsiderisksBetter-than-expectedcost-controlforPVglasssegment:Weforecast5.2pptdeclineforgrossmarginsofPVglassin2018.IfXinyiisabletoachievebetter-than-expectedcost-controlandhencegrossmargin,ourestimateswouldbeexposedtoupsiderisks.Faster-than-expectedsolarfarmconstruction:WeforecastXinyitoadd150/200/300MWsolarfarmprojectsover2018-20.Ifactualsolarfarmconstructionwerecompletedfasterthanexpected,ourestimateswouldbeexposedtoupsiderisks.Higher-than-expectedoperatingefficiencyofsolarfarmoperationbusiness:Weforecast76.2%/76.5%/77.4%grossmarginforsolarfarmoperation.IfXinyidelivershigher-than-expectedoperatingefficiencyforitssolarfarmoperation,our
estimateswouldbeexposedbyupsiderisks.
研究中国LongyuanPower(0916.HK):Offshoreprojectstosupportinstallations;initiateatNeutralonlimitedupsideLongyuanisthelargestwindfarmoperatorinChinawith18GWinwindpowercapacityand1.9GWincoal-firedpowercapacityasof3Q18.Over2013-17,theaverageutilizationofLongyuan’swindfarmsis2%-9%higherthanthenationalaverage,whichweattributetoitsoutstandingprojectselectionandoperationalcapability.Withitsoffshoreprojectstosupportpowercapacityandlesscurtailmenttoimproveutilization,weforecast11%netincomeCAGRover2018-20,lowerthanHNR’sbutinlinewiththesectoraverage.Offshoreprojectstodriveinstallations:Asof3Q18,Longyuanhasover5GWwindprojectsinthepipeline,c.1GWofwhichareoffshore.Hence,weexpectLongyuantoadd430/260/260MWonshoreand250/300/300MWoffshorewindpowercapacityover2018/19/20.Withmorehigh-qualityadditionsfromoffshorewindprojects,weexpectLongyuan’stotalwindpowercapacitytoreach20.2GWby2020.Continuedreductionincurtailmenttosupportutilization:WeestimateLongyuan’saveragecurtailmentwasc.6%in9M18,andexpectcurtailmenttodropbyafurther1-2pptp.a.over2019-20,supportingutilizationandpowersales.WeexpectLongyuan’saverageutilizationofwindpowertogrow2%CAGRover2018-20,andrevenuefrompowersalestorecord6%CAGRoverthesameperiod.InitiateatNeutralonlimitedupside:Longyuanistradingat5.6x2019EV/EBITDAvs.itspast3-yearaverageandmedianof7.3xand7.4xrespectivelyandcomparablepeers’historicalaverageof8.0x.Sincethebeginningof2018,Longyuanhasbeentradingbetweenitspast3-yearaverageand1stdbelowtheaverage.Itappearsthereisade-ratingin2018comparedtotheaverageof2016/17,duetoinvestorconcernsonsubsidypaymentandutilization.WeexpecttheseissuestograduallyeaseoverasRPSgetsreinforced,andapply1stdbelowthehistoricalaverage(5.7x2019EV/EBITDA)toderiveour12-monthtargetpricesofHKD6.1.Witha13%upside,weinitiatecoverageofLongyuanatNeutral.
研究中国图表167:FinancialsummaryProfitmodel(Rmbmn)12/1712/18E12/19E12/20ETotalrevenue24,591.627,724.729,182.930,142.5Costofgoodssold(6,544.8)(7,037.2)(7,255.9)(7,394.5)SG&A(2,218.4)(2,495.2)(2,918.3)(2,863.5)R&D--------Otheroperatingprofit/(expense)(693.2)(912.6)(1,034.5)(1,101.0)EBITDA15,135.217,279.617,974.318,783.4Depreciation&amortization(6,798.3)(7,178.5)(7,580.1)(8,001.9)EBIT8,336.910,101.210,394.110,781.6Interestincome208.0565.91,234.01,784.7Interestexpense(3,423.4)(3,457.4)(3,454.7)(3,402.2)Income/(loss)fromuncons.subs.343.9354.2363.0373.9Others0.00.00.00.0Pretaxprofits5,465.47,563.88,536.59,538.0Incometax(915.7)(1,514.0)(1,863.5)(2,107.7)Minorities(861.6)(1,297.1)(1,419.9)(1,569.2)Netincomepre-preferred3,688.14,752.75,253.05,861.1Preferreddividends--------Netincome(pre-exceptionals)3,688.14,752.75,253.05,861.1Posttaxexceptionals--------Netincome3,688.14,752.75,253.05,861.1EPS(basic,pre-except)(Rmb)0.460.590.650.73EPS(basic,post-except)(Rmb)0.460.590.650.73EPS(diluted,post-except)(Rmb)0.460.590.650.73DPS(Rmb)0.090.120.130.15Dividendpayoutratio(%)20.020.020.020.0Freecashflowyield(%)5.115.012.317.0Growth&margins(%)12/1712/18E12/19E12/20ESalesgrowth10.312.75.33.3EBITDAgrowth9.014.24.04.5EBITgrowth10.521.22.93.7Netincomegrowth8.028.910.511.6EPSgrowth8.028.910.511.6Grossmargin73.474.675.175.5EBITDAmargin61.562.361.662.3EBITmargin33.936.435.635.8Cashflowstatement(Rmbmn)12/1712/18E12/19E12/20ENetincomepre-preferreddividends3,688.14,752.75,253.05,861.1D&Aadd-back6,798.37,178.57,580.18,001.9Minoritiesinterestsadd-back861.61,297.11,419.91,569.2Net(inc)/decworkingcapital(1,825.8)238.4(928.0)472.5Otheroperatingcashflow2,610.42,537.41,857.71,243.6Cashflowfromoperations12,132.616,004.015,182.717,148.2Capitalexpenditures(9,403.8)(8,180.4)(8,422.4)(7,334.2)Acquisitions--------Divestitures--------Others790.02,180.42,953.13,565.8Cashflowfrominvestments(8,613.8)(6,000.0)(5,469.3)(3,768.4)Dividendspaid(common&pref)(683.1)(737.6)(950.5)(1,050.6)Inc/(dec)indebt1,595.2(1,000.0)(1,600.0)(1,600.0)Commonstockissuance(repurchase)--------Otherfinancingcashflows(1,264.5)(2,376.4)(2,271.3)(2,094.4)Cashflowfromfinancing(352.4)(4,114.0)(4,821.8)(4,745.0)Totalcashflow3,166.45,890.04,891.68,634.9Balancesheet(Rmbmn)12/1712/18E12/19E12/20ECash&equivalents5,071.610,961.615,853.224,488.1Accountsreceivable7,154.57,277.57,913.67,777.0Inventory953.41,051.81,015.71,091.3Othercurrentassets3,942.73,942.73,942.73,942.7Totalcurrentassets17,122.223,233.628,725.237,299.1NetPP&E109,473.4109,968.1110,454.4109,405.7Netintangibles10,856.810,371.89,886.99,402.0Totalinvestments4,482.24,779.15,083.25,396.6Otherlong-termassets3,700.53,135.42,316.21,461.5Totalassets145,635.0151,488.1156,465.9162,965.0Accountspayable1,890.92,350.72,022.72,434.3Short-termloans35,774.235,274.234,474.233,674.2Othercurrentliabilities9,494.39,707.39,807.39,929.0Totalcurrentliabilities47,159.447,332.246,304.246,037.4Long-termdebt41,620.241,120.240,320.239,520.2Otherlong-termliabilities3,556.23,556.23,556.23,556.2Totallong-termliabilities45,176.344,676.343,876.343,076.3Totalliabilities92,335.892,008.590,180.589,113.7Preferredshares--------Totalcommonequity41,134.944,937.049,139.453,828.3Minorityinterest12,164.414,542.517,145.920,022.9Totalliabilities&equity145,635.0151,488.1156,465.9162,965.0BVPS(Rmb)5.125.596.116.70Ratios12/1712/18E12/19E12/20ECROCI(%)8.28.88.78.7ROE(%)9.311.011.211.4ROA(%)2.63.23.43.7Inventorydays55.652.052.052.0Receivablesdays96.995.095.095.0Payabledays123.8110.0110.0110.0Netdebt/equity(%)135.7110.088.966.0Interestcover-EBIT(X)2.63.54.76.7Valuation12/1712/18E12/19E12/20EP/Ebasic(X)11.37.97.26.4P/B(X)1.00.80.80.7EV/EBITDA(X)8.36.86.35.7EV/GCI(X)0.80.70.60.6Dividendyield(%)1.82.52.83.1Note:Lastactualyearmayincludereportedandestimateddata.Source:Companydata,GoldmanSachsResearchestimates.资料来源:Companydata,GaoHuaSecuritiesResearch
LargestwindfarmoperatorinChinaLongyuanisthelargestwindfarmoperatorinChinawith18GWwindpowerand1.9GWcoal-firedpowercapacityasof3Q18.In2017,Longyuansold33,013Gwhofwindpowerandwindpowersalesaccountedfor81%oftotalpowerrevenue.Over2012-17,EBITgrewbyaCAGRof7%.图表168:Windpowercapacitygrewfrom11GWin2012to18GWin2017Capacitybreakdown图表169:Historicalandforecastelectricitysales(MW)(Gwh)25,00060,00020,00050,00015,00010,0005,00040,00030,00020,00010,00002015201620172018E2019E2020E02015201620172018E2019E2020EWindCoal-firedOtherrenewablesWindpowerCoalpowerOtherrenewableenrgy资料来源:Companydata,GaoHuaSecuritiesResearch资料来源:Companydata,GaoHuaSecuritiesResearch图表170:Windpoweraccountedfor81%oftotalpowerrevenuein2017(Rmbmn)Revenuebreakdownbysegment图表171:Longyuanrecorded7%EBITCAGRover2012-17EBITandEBITmargin35,00030,00025,00020,00015,00010,0005,00002015201620172018E2019E2020E12,00010,0008,0006,0004,0002,00002015201620172018E2019E2020E37%(Rmbmn)37%36%36%35%35%34%34%33%33%WindpowerCoalpowerOtherpowerServiceconcessionconstructionAllothersEBITEBITmargin(RHS)研究中国资料来源:Companydata,GaoHuaSecuritiesResearch资料来源:Companydata,GaoHuaSecuritiesResearchOffshoreprojectstodriveinstallationsAsaleadingwindfarmoperator,Longyuan’swindfarmshaveconsistentlydeliveredhigherutilizationhoursthanthenationalaverage.Over2013-17,theaverageutilizationofLongyuan’swindfarmsis2%-9%higherthanthenationalaverage.Webelievethisisdueto:1)Longyuanbeingabletosecurehigh-qualitysiteswithsolidwindresourcesandlocalpowerdemandforitswindfarmprojects;and2)solidexperiencetodrivecontinuedoptimizationofoperatingefficiency.
图表172:WeexpectLongyuantoadd680/610/610MWinwindcapacityover2018/19/20Accumulativecapacityandnewadditionforecast图表173:WeexpectLongyuantoadd250/300/300MWinoffshorecapacityover2018/19/20Newwindpowercapacityadditionbreakdown25,00020,00015,00010,0005,0000201620172018E2019E2020EWindCoal-fired1,800(MW)(MW)1,6001,4001,2001,00080060040020001,8001,6001,4001,2001,0008006004002000(MW)201620172018E2019E2020EOtherrenewablesNewaddition-on-shorewind(RHS)Newaddition-off-shorewind(RHS)On-shoreoff-shore资料来源:Companydata,GaoHuaSecuritiesResearch资料来源:Companydata,GaoHuaSecuritiesResearchAsof3Q18,Longyuanhasover5GWofwindprojectsinthepipeline,closeto1GWofwhichareoffshore.WeexpectLongyuantoadd430/260/260MWofon-shoreand250/300/300MWoffshorewindpowercapacityover2018/19/20.Withmorehigh-qualityadditionsfromoffshorewindprojects,weexpectLongyuan’stotalwindpowercapacitytoreach20.2GWby2020.ContinuedreductionincurtailmenttodriveutilizationThankstocontinuedreinforcement(seeguaranteedpurchaseofelectricitygeneratedbyrenewableenergypower)androbustpowerdemandacrossChina,thecurtailmentratioforLongyuan’swindfarmshasseenasubstantialdeclinesince2016,withaverageutilizationrisingfrom1,888hoursin2015to2,025hoursin2017.WeestimateLongyuan’saveragecurtailmentwasc.6%in9M18,andexpectcurtailmenttodropbyafurther1-2pptp.a.over2019-20,drivingutilizationandpowersales.WeexpectLongyuan’saverageutilizationofwindpowertogrow2%CAGRover2018-20,andrevenuefrompowersalestorecord5%CAGRoverthesameperiod.图表174:Averageutilizationrecoveredsince2016Salesofwindpowerandaverageutilizationforecasts图表175:WeexpectLongyuantodeliver5%revenueCAGRfromwindpowerover2018-20Revenuefromwindpowerandaverageutilization45,00040,00035,00030,00025,00020,00015,00010,0005,00002015201620172018E2019E2020E2,250(Gwh)(Hours)2,2002,1502,1002,0502,0001,9501,9001,8501,8001,7501,70025,00020,00015,00010,0005,0000201620172018E2019E2020E3,000(Rmbmn)(hours)2,5002,0001,5001,0005000研究中国SalesofwindpowerAverageutilization(RHS)RevenuefromwindpowerAverageutilization(RHS)Averageoff-shoreutilization(RHS)
资料来源:Companydata,GaoHuaSecuritiesResearch/资料来源:Companydata,GaoHuaSecuritiesResearch
FinancialstatementanalysisP&L:Weforecast4%revenueCAGRover2018-20onmoderatecapacityadditionsandutilizationimprovement(vs.2%CAGRforutilizationimprovementover2018-20).WeexpectEBITmarginstobe36.4%/35.6%/35.8%in2018/19/20.Thisisduetoour10%/9.5%SG&Aratioassumptionfor2019/20comparedto9.0%in2018onthebackofmanagementchanges.WeexpectLongyuantorecordnetincomeofRmb4.75bn/Rmb5.25bn/Rmb5.86bnin2018/19/20,implying11%CAGRovertheperiod.BalanceSheet:Longyuan’snetgearingwas136%byend-2017.Weexpectnetgearingtofallto110%/89%/66%duetomoderatecapexspendingbasedonitscurrentapprovedpipeline.Weexpect2018/20receivabledaystobe95/95/95vs.97in2017onbettersubsidypayment.CashFlow:WeestimateRmb8.2bn/Rmb8.4bn/Rmb7.3bncapexin2018/19/20,mainlytosupporttheconstructionofitswindfarmprojects.Weexpectthecompany’snetcashflowtobeRmb5.9bn/Rmb4.9bn/Rmb8.6bnin2018/19/20.InitiateatNeutralLongyuanistradingat5.6x2019EV/EBITDAvs.itspast3-yearaverageandmedianof7.3xand7.4xrespectivelyandcomparablepeers’historicalaverageof8.0x.Sincethebeginningof2018,Longyuanhasbeentradingbetweenitspast3-yearaverageand1stdbelowtheaverage.Itappearsthereisade-ratingin2018comparedtotheaverageof2016/17,duetoinvestorconcernsonsubsidypaymentandutilization.Assuch,weapply1stdbelowitshistoricalaverage(0.5stdbelowHNR’stargetmultipleonlowerEBITDAgrowthoutlook)toderiveour2019EV/EBITDAtargetmultiple.Webasedour12-monthtargetpriceofHKD6.1onatarget2019EV/EBITDAmultipleof5.7x(1stdbelowhistoricalaverage).图表176:CurrentEV/EBITDAvs.peers图表177:HistoricalEV/EBITDA86%876%775%75%764%664%663%Longyuan-currentPeergroupLongyuan-historical10.0+1std:8.9xAve:7.3x-1std:5.7x9.08.07.06.05.04.03.02.01.0研究中国2018EV/EBITDA2019EV/EBITDA18-20EEBITDAcagr(RHS)0.01/1/20167/1/20161/1/20177/1/20171/1/20187/1/2018资料来源:Wind,Bloomberg,GaoHuaSecuritiesResearch资料来源:Wind,GaoHuaSecuritiesResearch
图表178:HistoricalEV/EBITDAvs.EBITDACAGR109876543DatangHNRLongyuanEDPRenovaveisAverageMedian13-17EBITDAcagr(RHS)20%18%16%14%12%10%8%6%4%2%0%研究中国资料来源:Wind,GaoHuaSecuritiesresearchKeyupside/downsiderisksHigher/lower-than-expectedutilizationhours.Utilizationhourisdeterminedbywindresourcesandgridabsoption.Eitherlower-than-expectedwindresourcesorgridabsoptionwouldresultinlower-than-expectedutilizationhoursforthecompanyandviceversa.Thiswouldimpactthecompany’sEBITmarginandposeupside/downsideriskstoourestimates.Faster/slower-than-expectednewcapacityaddition.WeforecastLongyuantoadd680/610/610MWincapacityover2018-20E.Ifcapacityadditionturnedfaster/slowerthanexpected,ourrevenueforecastswouldbeexposedtoupside/downsiderisks.Higher-than-expectedrepairandmaintenancecost.Windturbinesusuallyoffer5-7yearsofwarranty.Ifturbinesdonotfunctionnormallyaftertheexpirationofwarranty,repairandmaintenancecostwouldbehigherthanexpected.Assuch,Longyuan’sEBITmarginwouldbedraggedbyhigher-than-expectedrepairandmaintenancecost.
研究中国SungrowPower(300274.SZ):Growingglobalsharesbutvaluationfair;initiateatNeutralSungrowisthelargestsolarinvertermakerinChinawith15.7%globalmarketsharein2017.Webelieveitscompetitiveadvantageliesin:1)leadingpowerconvertingtechnologywhichhasdrivenconsistenthigh-qualityproductroll-outs;and2)strategicdeploymentintothesolarfarmsystemintegrationbusinesstocreatesynergywithitssolarinverterbusiness.Invertergainingshareoverseas,optimizingproductmixtosustainmargins:Withitsoverseascapacityrampingupafteryearsofdevelopment,weestimateSungrow’soverseasshipmenttogrowby34%CAGRover2018-20.ForitsChinashipment,weexpecttoseea20%declinein2018duetothequotacancellationpolicyandexpect20%/30%yoyincreasein2019/20asdemandrecovers.WeforecasttotalinvertersalestogrowfromRmb3.4bnin2018toRmb5.3bnin2020,representingaCAGRof26%.Continuedproductoptimizationandsolidcostcontrolcouldsustaingrossmarginatthe37%-38%levelinourview.Systemintegrationbusinessdraggedbylower2H18demandinChinabuttobenefitfromconsolidationoverthelongterm:Adverselyimpactedbyquotacancellationpoliciesin2H18,weexpectprojectvolumetodecline5%to950MWin2018andgraduallyrecoverto1.2/1.6GWin2019/20.WeexpectmarketconcentrationandentrybarriersforthesolarfarmEPC/BT(Engineering,ProcurementandConstruction/BuildandTransfer)markettograduallyimproveasdownstreamsolarfarminvestorshaveshownincreasingpreferenceforLCOE-orientedfull-cycleEPC/BTservicesprovidedbylarge-scaleleadingEPC/BTcompaniesperourchannelchecks.WeseeSungrowasbest-positionedtobenefitfromrisingsectorconsolidationoverthelongterm.Fairvaluation:Sungrowistradingat7.1x2019EV/EBITDA,vs.itspast5-yearaverageandmedianof19.1xand18.6xrespectively,whichwebelievewasduetoitshighEBITDAgrowthandhigheroverallvaluationoftheGrowthEnterpriseMarket(GEM)boardover2013-15.Sungrow’scomparablepeergrouphasahistoricalaverageof8.6x.Given19%upsidepotentialimpliedbyour12-monthtargetpriceofRmb11.0,weinitiatecoverageatNeutral.
研究中国图表179:FinancialsummaryProfitmodel(Rmbmn)12/1712/18E12/19E12/20ETotalrevenue8,886.18,288.010,058.413,052.2Costofgoodssold(6,464.1)(6,045.6)(7,320.7)(9,539.4)SG&A(1,129.0)(1,077.4)(1,307.6)(1,670.7)R&D--------Otheroperatingprofit/(expense)(27.9)(29.3)(32.2)(33.8)EBITDA1,390.61,275.91,568.12,014.5Depreciation&amortization(125.6)(140.2)(170.2)(206.2)EBIT1,265.01,135.71,397.91,808.3Interestincome22.429.236.044.0Interestexpense(44.8)(73.3)(91.2)(105.0)Income/(loss)fromuncons.subs.--------Others(80.8)(94.0)(141.2)(174.1)Pretaxprofits1,161.8997.61,201.51,573.2Incometax(147.5)(129.7)(156.2)(204.5)Minorities9.9(3.6)(4.2)(5.0)Netincomepre-preferred1,024.2864.31,041.11,363.8Preferreddividends--------Netincome(pre-exceptionals)1,024.2864.31,041.11,363.8Posttaxexceptionals------1.0Netincome1,024.2864.31,041.11,364.8EPS(basic,pre-except)(Rmb)0.710.600.720.94EPS(basic,post-except)(Rmb)0.710.600.720.94EPS(diluted,post-except)(Rmb)0.710.600.720.94DPS(Rmb)0.080.070.090.11Dividendpayoutratio(%)11.312.012.012.0Freecashflowyield(%)2.63.64.76.8Growth&margins(%)12/1712/18E12/19E12/20ESalesgrowth48.0(6.7)21.429.8EBITDAgrowth77.3(8.2)22.928.5EBITgrowth73.5(10.2)23.129.4Netincomegrowth85.0(15.6)20.531.1EPSgrowth85.0(15.6)20.531.1Grossmargin27.327.127.226.9EBITDAmargin15.615.415.615.4EBITmargin14.213.713.913.9Cashflowstatement(Rmbmn)12/1712/18E12/19E12/20ENetincomepre-preferreddividends1,024.2864.31,041.11,363.8D&Aadd-back125.6140.2170.2206.2Minoritiesinterestsadd-back(9.9)3.64.25.0Net(inc)/decworkingcapital(469.6)(40.4)(217.2)(291.4)Otheroperatingcashflow179.1------Cashflowfromoperations849.3967.7998.31,283.5Capitalexpenditures(356.5)(469.3)(351.0)(348.9)Acquisitions--------Divestitures--------Others186.8------Cashflowfrominvestments(169.7)(469.3)(351.0)(348.9)Dividendspaid(common&pref)(121.0)(115.9)(103.7)(124.9)Inc/(dec)indebt713.3300.0250.0250.0Commonstockissuance(repurchase)305.1------Otherfinancingcashflows(353.2)------Cashflowfromfinancing544.2184.1146.3125.1Totalcashflow1,223.8682.5793.61,059.7Balancesheet(Rmbmn)12/1712/18E12/19E12/20ECash&equivalents2,921.33,603.84,397.35,457.0Accountsreceivable5,934.65,676.76,613.78,403.5Inventory2,372.62,252.62,507.13,136.2Othercurrentassets1,943.51,943.51,943.51,943.5Totalcurrentassets13,172.013,476.515,461.618,940.2NetPP&E1,746.82,082.22,269.52,418.9Netintangibles86.680.373.867.2Totalinvestments65.365.365.365.3Otherlong-termassets1,177.31,177.31,177.31,177.3Totalassets16,248.016,881.719,047.622,668.9Accountspayable6,463.96,045.67,019.89,147.4Short-termloans10.0110.0160.0210.0Othercurrentliabilities1,404.91,404.91,404.91,404.9Totalcurrentliabilities7,878.87,560.58,584.810,762.3Long-termdebt1,223.41,423.41,623.41,823.4Otherlong-termliabilities122.6122.6122.6122.6Totallong-termliabilities1,346.11,546.11,746.11,946.1Totalliabilities9,224.99,106.610,330.812,708.4Preferredshares--------Totalcommonequity6,943.87,692.28,629.69,868.4Minorityinterest79.383.087.292.1Totalliabilities&equity16,248.016,881.719,047.622,668.9BVPS(Rmb)4.785.305.946.80Ratios12/1712/18E12/19E12/20ECROCI(%)26.418.121.627.2ROE(%)15.911.812.814.8ROA(%)7.35.25.86.5Inventorydays104.8139.6118.7108.0Receivablesdays209.8255.7223.0210.0Payabledays303.5377.6325.7309.3Netdebt/equity(%)(24.0)(26.6)(30.0)(34.4)Interestcover-EBIT(X)56.325.725.329.6Valuation12/1712/18E12/19E12/20EP/Ebasic(X)18.215.813.110.0P/B(X)2.71.81.61.4EV/EBITDA(X)12.39.27.15.1EV/GCI(X)3.11.92.01.6Dividendyield(%)0.60.80.91.2Note:Lastactualyearmayincludereportedandestimateddata.Source:Companydata,GoldmanSachsResearchestimates.资料来源:Companydata,GaoHuaSecuritiesResearch
LargestsolarinvertermakerinChinaIncorporatedin1997,SungrowisthelargestsolarinvertermakerinChina,andhasshippedanaggregateof68GWinvertersgloballyasof1H18.Thecompanyisalsoactivelyexpandingtosolarfarmsystemintegration,energystorageequipment,andEVelectricalcontrolmanufacturingbusinesstocreateanintegratedpowerconversionsolutionforsolarfarminvestors.In2017,thesolarinverterandsystemintegrationsegmentscontributed41%and53%tototalrevenueswithgrossmarginsat38.7%and15.8%respectively.Over2012-17,Sungrowgrewitsglobalmarketsharefrom3.0%to15.7%.Webelieveitscompetitiveadvantageliesinits:1)leadingpowerconvertingtechnologywhichhasdrivenconsistenthigh-qualityproductroll-outsand2)strategicdeploymentintothesolarfarmsystemintegrationbusinesstocreatesynergywithitssolarinverterbusiness.图表180:Sungrowhasa15.7%globalmarketsharebyend-2017Solarinvertershipmentandglobalmarketshare图表181:ThesolarinverterandEPCsegmentsaccountedfor41%and53%oftotalrevenuesin2017Revenuesbysegmentandyoygrowthoftotalrevenues18,00016,00014,00012,00010,0008,0006,0004,0002,000018%(MW)16%14%12%10%8%6%4%2%0%14,00012,00010,0008,0006,0004,0002,0000(Rmbmn)2015201620172018E2019E2020E60%50%40%30%20%10%0%-10%201220132014201520162017ChinashipmentOverseasshipmentGlobalshare(RHS)SolarinverterWindinverterSolarEPC&BTSolarpowerEnergystorageEVE-ControlOthersYoYgrowth(RHS)资料来源:PVinsight资料来源:Companydata,GaoHuaSecuritiesResearch图表182:Grossmarginsforsolarinverter/EPC/blended图表183:Netprofitgrew70%CAGRover2012-17NetprofitandEBITmargins45%40%35%30%25%20%15%10%5%1,6001,4001,2001,00080060040020015%(Rmbmn)14%14%13%13%12%12%0%2015201620172018E2019E2020EBlendedSolarinverterSolarEPC&BT02015201620172018E2019E2020ENetprofitEBITmargin11%研究中国资料来源:Companydata,GaoHuaSecuritiesResearch资料来源:Companydata,GaoHuaSecuritiesResearchSolarinverterdraggedbylowerChinademandin2H18butgainingsharesoverseas
SolarinverterisacriticalcomponentofasolarpowerprojectanditsmainfunctionistotrackthemaximumpoweroutputofthePVarrayandconnectenergytothegridwith
minimumenergyconsumptionandmaximumpowerquality.High-qualityinvertersisthekeytothelong-termreliabilityandinvestmentreturnofoperators.Assuch,webelieveleadingmanufacturershavehigherbrandequitycomparedwithsmallerplayers.AsthelargestsolarinvertermakerinChina,SungrowhasmaintaineditsChinamarketshareatanaverageofc.30%over2012-17onthebackofitsleadingpowerconvertingtechnology.Tofurtherdriveglobalmarketsharegains,Sungrowhasbeenactivelyexploringtheoverseasmarkets,buildinga5GWinverterfactoryinIndiatofacilitateoverseassales.In2017,overseasshipmentreached3.3GW,up171%yoy,anditsoverseasmarketshareexpandedfrom2.1%to6.4%.Withoverseascapacityrampingupafteryearsofdevelopment,weexpect2018tomarkthestartofahigh-growthperiodforSungrow’soverseasshipments.TheEU,India,andAsiaarethetopthreeoverseasmarketsforSungrowbasedonourestimate.Weforecastoverseasshipmentstogrowby34%CAGRover2018-20.ForChinashipments,weexpecttoseea20%declinein2018duetothequotacancellationpolicyandexpect20%/30%yoyincreasein2019/20asdemandrecovers.Overall,weforecasttotalinvertersalestogrowfromRmb3.3bnin2018toRmb5.3bnin2020,representingaCAGRof26%.图表184:RisingmarketshareinoverseasmarketsMarketsharebyregion图表185:WeexpectSungrowtoseeoverseasshipmentsgrowby39%CAGRover2017-20Solarinverterrevenueandshipmentforecast50%45%40%35%30%25%20%15%10%5%0%20122013201420152016201718%16%14%12%10%8%6%4%2%0%6,0005,0004,0003,0002,0001,0000201620172018E2019E2020E30,000(Rmbmn)(MW)25,00020,00015,00010,0005,0000研究中国Global(RHS)ChinaOverseas(RHS)ChinarevenueOverseasrevenueChinashipment(RHS)Overseasshipment(RHS)资料来源:PVinsight资料来源:Companydata,GaoHuaSecuritiesResearch
研究中国图表186:Sungrowhasbeenconsistentlylaunchinghigh-efficiencyinverterproductsSG160HV,1500VSG1250UD,1500kwSG80HV,1000kwSG2500,2500kwOptimizedcentralizedinverter-Efficientfunctionundefreaturin-1g0%5highcircumstancesgenerationsuchash-ighimprovementtemperature,wet,etcFirst1500Vstringinverterwithconversionefficiencyhigherthan99%-Savesystemcostsby0.05rmb/wFirstcentralizedinverterwithhighestinputvoltageinChinaSungrow’sinverterproductlaunches资料来源:CompanydataASPforSungrow’ssolarinvertersdeclinedby8%fromRmb0.24/win2015toRmb0.22/win2017.Nevertheless,Sungrowmanagedtoexpanditsgrossmarginfrom31.4%to38.7%,thehighestamongleadingA-sharepeers.Webelievethisisdueto:1)Sungrowcontinuouslyrollingoutmorehigh-efficiencyStringinvertersandanoptimizedproductmix;2)solidcost-control.Over2018-20,weestimateASPtodeclineby4%/2%/2%(moredeclinein2018duetolowerChinademandin2H18,over2019-20,weexpectASPdeclinetoeaseoff,broadlyinlinewithcostreduction),andinverter’sgrossmargintofall1.7pptto37%in2018beforerecoveringto37.5%/37.9%in2019/20asthecompanycontinuestooptimizeitsproductmix.
图表187:Sungrowrecordedthehighestgrossmarginin2017GrossmarginsforSungrow/Kstar/Kelu/East’ssolarinvertersegment图表188:WeexpectgrossmargintosustainonproductmixoptimizationandsolidcostcontrolASPandgrossmarginforecasts45%40%35%30%25%20%15%10%5%0%201520162017KeluKstarEastSungrowASP-Sungrow(RHS)0.25(Rmb/w)0.240.240.230.230.220.220.210.230.230.220.220.210.210.200.20201620172018E2019E2020EASPGrossmargin(RHS)40%(Rmb/w)39%38%37%36%35%34%33%32%31%30%研究中国资料来源:Companydata资料来源:Companydata,GaoHuaSecuritiesResearchSystemintegrationbusinessdraggedbylower2H18demandinChinabuttobenefitfromconsolidationoverthelongtermSungrowstarteditssolarfarmsystemintegrationbusinessin2013.Webelievetherearestrongsynergyopportunitiesbetweenthesolarinverterandsystemintegrationbusinesses,asnotonlycanSungrowleverageitsbrandequityfromtheinvertersegmentbutitcanalsopromoteinvertersalesthroughitssystemintegrationbusiness.Sungrow’sofferingfeaturesaLCOE-orientedfull-cyclesolarfarmEPC/BTsolution,combiningitssector-leadingprojectconsulting,siteevaluation,andequipmentselection/integrationcapability.Over2014-17,Sungrowgrewitsprojectvolumefrom20MWto1GW,representingaCAGRof71%.Adverselyimpactedbyquotacancellationpoliciesin2H18,weexpectprojectvolumetodecline5%to950MWin2018andgraduallyrecoverto1.2GWand1.6GWin2019/20.WebelievethesolarfarmEPC/BTmarketinChinaisfairlyfragmentedcurrentlywiththetop10playersonlyaccountingforc.20%marketshare.WeexpectindustryconsolidationandentrybarriersforthesolarfarmEPC/BTmarkettograduallyimproveasdownstreamsolarfarminvestorshaveindicatedincreasingpreferenceforLCOE-orientedfull-cycleEPC/BTservicesprovidedbylarge-scaleleadingEPC/BTcompanies.WebelieveSungrowisbest-positionedtoleverageonrisingsectorconsolidationoverthelongterm.
图表189:Sungrow’sprojectdeliveryaccount1.4%-1.9%ofChinainstallationSungrow’ssolarfarmsystemintegrationprojectvolumeandChinainstallation图表190:ItssolarfarmsystemintegrationbusinessislikelytosufferfromlowerChinademandin2H18Solarfarmsystemintegrationprojectvolumeandrevenueforecast6000050000400003000020000100001200(MW)(MW)10008006004002008,0007,0006,0005,0004,0003,0002,0001,0001,800(MW)1,6001,4001,2001,000800600400200002014201520162017ChinainstallationEPC&BT(RHS)00201620172018E2019E2020ERevenueProjectvol研究中国资料来源:Companydata资料来源:Companydata,GaoHuaSecuritiesResearchFinancialstatementanalysisP&L:WeexpectSungrowtorecord7%revenuedeclinein2018duetolowerinvertershipmentandEPCprojectsinChina,andrevenuetogrow21%/30%in2019/20asChinademandrecoversandoverseasmarketshareexpands.Weexpectgrossmargintosee0.2pptdeclineto21.7%in2018mainlyduetothelowergrossmarginsofitssolarinverter.Weexpect2019/20grossmargintoimproveto27.2%/26.9%(asinverterASPdeclineeasesoffwithdemandpickingupandthecompanymayfurtheroptimizeitsproductmixandreduceproductioncosts).Weexpect2018-20EBITmargintobe13.7%/13.9/13.9%in2018/19/20,andnetincomeatRmb864mn/Rmb1.04bn/Rmb1.36bn,implyinga26%CAGR.BalanceSheet:Sungrow’snetgearingwas-24%andcashbalancewasRmb2.9bnbyend-2017.Weexpectnetgearingtobe-27%/-30%/-34%duetomoderatecapexspending(duetolimitedcapacityexpansionplan)over2018-20.CashFlow:WeforecastRmb469mn/Rmb351mn/Rmb349mncapexover2018/19/20,mainlytosupportitsEPCprojects.Weexpectthecompany’snetcashflowtobeRmb682mn/Rmb794mn/Rmb1.1bnover2018/19/20.
Salesvolume(MW)201620172018E2019E2019ESolarinverter11,10216,50015,51019,10725,354SolarEPC&BT4781,0009501,1881,603Revenue(Rmbmn)201620172018E2019E2019ESolarinverters2,4943,6823,3364,0405,259Windinverters8665717791SolarEPC&BT3,2854,6674,3015,2686,970Solarelectricitysales25249325376389Energystorage7964728499EVcontrol&drivesystem27577189108Others8102112123136Total6,0048,8868,28810,05813,052Yoy31%48%-7%21%30%Grossmargin201620172018E2019E2019ESolarinverters33%39%37%37%38%Windinverters40%38%38%38%38%SolarEPC&BT17%16%16%16%16%Solarelectricitysales63%68%72%75%75%Energystorage16%30%28%27%27%EVcontrol&drivesystem37%25%23%23%23%Others93%28%27%27%28%Total25%27%27%27%27%EBITmargin12%14%14%14%14%图表191:Keyassumptions资料来源:Companydata,GaoHuaSecuritiesResearchInitiateatNeutralonlimitedupsideSungrowistradingat7.1x2019EEV/EBITDA,vs.itspast5-yearaverageandmedianof19.1xand18.6xrespectively,whichwebelievewasduetoitshighEBITDAgrowthandhigheroverallvaluationoftheGrowthEnterpriseMarket(GEM)boardover2013-15.HistoricalaverageofSungrow’speergroupwas8.6x.Webaseour12-monthtargetpriceofRmb11.0onatarget2019EV/EBITDAmultipleof8.5x(inlinewiththe5-yearhistoricalaverageofitspeergroup).Given19%upside,weinitiatecoverageatNeutral.图表192:CurrentEV/EBITDAvs.peers图表193:HistoricalEV/EBITDA+1std:28.1xAve:19.1x-1std:10.2x2530%60.02025%50.0151050Sungrow-currentPeergroupSungrow-historical20%15%10%5%0%40.030.020.010.0研究中国2018EV/EBITDA2019EV/EBITDA18-20EEBITDAcagr(RHS)0.01/1/20131/1/20141/1/20151/1/20161/1/20171/1/2018
资料来源:Wind,GaoHuaSecuritiesResearch资料来源:Wind,GaoHuaSecuritiesResearch
图表194:HistoricalEV/EBITDAvs.EBITDACAGR2570%60%2050%1540%30%1020%10%50%0SungrowSolaredgeChintCSIQJKSAverageMedian13-17EBITDAcagr(RHS)-10%研究中国资料来源:Wind,GaoHuaSecuritiesResearchKeyupside/downsiderisksHigher/lower-than-expectedoverseasshipment:WeexpectSungrowtorecord4.95/6.44/8.88GWinoverseasinvertershipmentover2018-20.WebelieveoverseasshipmentvolumesareakeydriverforSungrow’searningsoutlookandhigher/lower-thanexpectedoverseasshipmentwouldpostupside/downsiderisktoourestimates.Slower/faster-than-expectedEPCprojectdelivery:Weexpect950MW/1.2GW/1.6GWEPCprojectdeliveryover2018-20.RevenuesfromtheEPCbusinessaccountfor52%/52%/53%oftotalrevenueover2018/19/20onourestimates.Slower/faster-than-expectedEPCprojectdeliverycoulddrivedownside/upsideriskstoourestimates.Higher/lower-than-expectedgrossmarginforsolarinvertersales:WeexpectSungrowtorecord37.0%/37.5%/37.9%grossmarginforsolarinvertersalesover2018-20.GrossmarginofsolarinverterwillbedeterminedbyASPandproductioncost.Higher/lower-than-expectedgrossmarginforsolarinvertersaleswoulddriveupside/downsideriskstoourestimates.
研究中国APPENDICES
研究中国Appendix1:StabilityofsupplyfromupstreamkeycomponentWebelieveastablesupplyofupstreamkeycomponentsiscriticaltoChinawindandsolarpowerinstallation.Weassessthestabilityofupstreamsupplybyexaminingtherelianceonimportedsupplyintofourgrades:nNoreliance:Thecomponentcanbe100%producedinChina;nLowreliance:Thepartcontainscertaincomponentsthatcanbyonlypurchasedfrominternationalsuppliers,butthesesuppliershaveproductioncapacitiesinChina.nMediumreliance:Thepartcontainscertaincomponentsthatneedtobeimportedbutcouldbeimportedfrommultiplesuppliersfrommultipleoverseascounties.nHighreliance:Thepartcontainscertaincomponentsthatcanbeonlyimportedfromasinglesupplierfromasinglecountry.Ourresultsshowedthatpitchsystemsandconvertersforwindpowerandinvertersforsolarpowerareexposedtomediumrelianceonimportsfortheirkeycomponents.Mostothercomponentspostnoorlowrelianceonimportedcomponents.图表195:AssessmentofrelianceonimportedsupplyNorelianceLowrelianceMediumrelianceHighrelianceWindpowerBladeLow-speedshaftControllerWindvaneRotorGearboxGeneratorTowerPitchsystemYawdriveHigh-speedshaftConverterBrakeYawmotorAnemometerSolarpowerPolysiliconEVAfilmSolarwaferPVglassSolarcellBacksheetSolarmoduleAluminumframeDimondwireChorideSilverpasteHydrogenInverterMetalsilicon资料来源:GaoHuaSecuritiesResearch
Appendix2:Sectorbackground:highgrowthfueledbyhighsubsidySincetheRenewableEnergyLawofthePeople’sRepublicofChinawasestablishedatend-2009,China’swindandsolarpowerhaveseenarapidgrowthperiod.Accumulativecapacitiesofwindandsolargrewfrom61GWand3GWinby2011-endto163GWand129GWbyend-2017,representingaCAGRof22%and107%.In2017,China’swindandsolarinstallationaccountedfor35%and54%ofglobalnewinstallation.图表196:Chinawindpowerinstallation图表197:Chinasolarpowerinstallation18016014012010080604020035(GW)30252015105020072008200920102011201220132014201520162017AccumulativeNewaddition(RHS)140120100806040200(GW)6050403020100201220132014201520162017Utility-AccumulativeDG-AccumulativeNewaddition-total(RHS)资料来源:CEC资料来源:CEC,CPIA图表198:GlobalwindnewinstallationandChina’sshare图表199:GlobalsolarnewinstallationandChina’sshare(GW)7060%6050%5040%4030%3020%201010%12010080604020(GW)60%50%40%30%20%10%00%201220132014201520162017AsiaAfricaandmideastEurope00%201220132014201520162017LatinAmericaNortherAmericaOceaniaChinaas%ofglobal(RHS)AsiaEuropeNorthAmericaEmergingmarketsChinaas%ofglobal(RHS)研究中国资料来源:GWEC,CEC资料来源:PVinsightAsofend-2017,windandsolarcapacitiesaccountedfor9.2%and7.3%oftotalpowercapacitiesinChina,comparedwith5.4%and0.3%byend-2012.Generationshareofwindandsolargrewfrom2.1%and0.1%in2012to4.7%and1.8%in2017.
图表200:Chinaaccumulativecapacitymix图表201:Chinapowergenerationmix100%90%80%70%60%50%40%30%20%10%0%50%6%1%2%7%3%9%5%9%7%9%201220132014201520162017HydroCoal-firedNuclearWindSolar100%90%80%70%60%50%40%30%20%10%0%0.1%0.2%0.4%0.7%1.1%1.8%2.1%2.6%2.9%3.2%4.0%4.7%201220132014201520162017HydroCoal-firedNuclearWindSolar资料来源:CEC资料来源:CECWebelievetherapidcapacitygrowthforthewindandsolarsectorsinChinahasbeenmainlyfueledbyfavorablesubsidypolicies(i.e.,higherFiT).In2017,averageFiTofwindandsolarwas153%and51%higherthancoal-firedFiT.WeestimateannualsubsidiesforChinawindandsolarreachedRmb32bnandRmb61bnin2017.图表202:ChinawindpowerFiT图表203:ChinasolarpowerFiTandsubsidy0.70.61.3(Rmb/kwh)1.10.60.50.50.40.90.70.50.30.10.4(Rmb/kwh)201020112012201320142015201620172018ZoneIZoneIIZoneIIIZoneIV-0.2ZoneIZoneIIZoneIIIDGsubsidy研究中国资料来源:NDRC资料来源:NDRC
图表204:Annualwindandsolarsubsidyestimate70,000(Rmbmn)研究中国60,00050,00040,00030,00020,00010,000-2014201520162017WindSolar资料来源:NDRC,NEA,CEC,GaoHuaSecuritiesResearchEstimate
研究中国Appendix3:M&AFrameworkAcrossourglobalcoverage,weexaminestocksusinganM&Aframework,consideringbothqualitativefactorsandquantitativefactors(whichmayvaryacrosssectorsandregions)toincorporatethepotentialthatcertaincompaniescouldbeacquired.WethenassignanM&Arankasameansofscoringcompaniesunderourratedcoveragefrom1to3,with1representinghigh(30%-50%)probabilityofthecompanybecominganacquisitiontarget,2representingmedium(15%-30%)probabilityand3representinglow(0%-15%)probability.Forcompaniesranked1or2,inlinewithourstandarddepartmentalguidelinesweincorporateanM&Acomponentintoourtargetprice.M&Arankof3isconsideredimmaterialandthereforedoesnotfactorintoourpricetarget,andmayormaynotbediscussedinresearch.UnderourM&AframeworkfortheAsiaPacificEnergysector,werecognizeamyriadoffactorscouldinfluencetheprobabilityofadeal,andourregionalteamseesthefollowingasthefivekeycommondenominators:-Regulationonownershipthatprohibitsordiscouragesacquisitions,includingbyaforeignentity,ongroundsofnationalsecurity.-Regulatoryrisksthatdiscouragepotentialbuyersfromanacquisitionandcomplicaterealizationofplannedsynergyandrestructuringupside.-Managementstanceintermsofitsopennesstoadeal(e.g.,beingatargetofacquisition,managementbuyout),especiallybygovernmentappointees.-Strategicassetsthatoffertheownersastrongcompetitiveadvantageduetoahighentrybarrier(e.g.,monopoly)oralowcoststructure.-Industryattractivenessbasedonagrowingprofitpoolasafunctionofassetexpansion,revenuegrowth,orprofitabilityimprovement.Usinga1-4pointscoringsystem,wehavescoredoureightutilitiescompaniesasfollows:Regulationonownership(3-4):WebelieveshareholdingstructureconsiderationsmakeLYP,HNR,Goldwind(SOEmajorshareholder),Tongwei,andZhejiangChint(highlyconcentratedholdingsfromultimatecontrollers)unlikelytargetcompaniesinanacquisition.Withinourcoverage,weseeLongi,SungrowandXinyiashavingthehighestpossibilityofbeinganacquisitiontargetastheirshareholdingstructuresarelessofanobstacle.Regulatoryrisks(4):China’swindandsolarpowermarketaremoderatelyregulated—thegovernmentregulatestheFeed-in-Tariffandinstallationscale,butdoesnotimposehighentrybarriersfornewentrants.
Managementstance(4):Giventhescaleofthebusinessandgrowthoutlookoftheindustry,wedonotexpectmanagementtohaveanyintentiontosellstakes.
研究中国Strategicassets(2-3):Downstreamwindandsolarpowerassets(i.e.,Longyuan,Huaneng,ZhejiangChint)arerelativelymoreattractivethanupstreammanufacturingassets,astheprojectreturnsaremostlylockedinfor20yearsonceconnectedtothegrid.Industryattractiveness(2):Webelievetheindustryisattractiveintermsofsolidcostreductionpotentialandinstallationoutlook.图表205:Withinthiscontext,weassignanM&Arankof3totheeightutilitiescompanieswithinourcoverage.WindIndustryAttractivenessStrategicAssetsManagementRegulatoryrisksStanceRegulationonownershipM&ARankTickerCompanyChinaUtilitiesM&AframeworkLongyuanPower0916.HK344422HuanengRenewable0958.HK344422Goldwind002202.SZ/2208.HK344432SolarLongi601012.SS334432Tongwei600438.SS344432Sungrow300274.SZ334432Xinyisolar0968.HK334432ZhejiangChint601877.SS344422资料来源:GaoHuaSecuritiesResearchCompanylogodisclosuresThirdpartybrandsusedinthisreportarethepropertyoftheirrespectiveowners,andareusedhereforinformationalpurposesonly.Theuseofsuchbrandsshouldnotbeviewedasanendorsement,affiliation,orsponsorshipbyorforGoldmanSachsoranyofitsproducts/services.Unlessstatedotherwise,pricinginthisreportisasoftheDecember17,2018marketclose.
'
您可能关注的文档
- 中国环保与新能源行业分析报告
- 电气设备新能源行业2019年度策略:清风徐来,超配新能源
- 新能源行业2019年度策略:春风又绿江南岸,明月何时照我还
- 新能源行业2019年年度策略:新能源平价来临,关注逆周期因子
- 中国新能源行业现状分析与发展前景研究报告(2018年版)
- 新能源行业光伏系列报告之(十八):PERC电池进入全盛阶段,带来设备产业繁荣
- 中关村科技园区新能源行业及重点企业投资价值研究报告doc
- 电力设备与新能源行业2019年度策略报告:拥抱变革,连接未来
- 电力设备与新能源行业2019年投资策略报告:迎趋势,重格局,御风而上
- 电力设备与新能源行业2019年度策略报告:蜕变之际,破晓之年
- 2019年环保新能源行业投资策略:天然气前景亮丽,光伏走势看政策
- 电力设备及新能源行业光伏产业研究系列报告(2):硅片~路线之争尘埃落定,巨头厮杀仍将持续
- 电气设备与新能源行业:新能源汽车行业景气延续,产业链上游显著受益
- 新能源行业:节能照明,
- 电气设备与新能源行业2019年度策略:聚焦优势政策面下的结构性机会
- 新能源行业投资机会与风险分析论文
- 自动化设备技术在新能源行业的应用及发展
- 电力设备新能源行业2019年投资策略:脚步渐近,新能源迈向平民时代